Biology · BIO-003
Photosynthesis Leaf Disks
Sunken spinach disks rise in the light, one by one.
- NGSS HS-LS1-5
- AP Biology Unit 3
- AP Biology Investigation 5
Included with a subscription. Create a free account to get started.

About this lab
Infiltrate leaf disks and record their rise under a lamp and their response when the lamp is turned off. High school students use the interactive 3D setup to vary illumination, light color, bicarbonate supply, and temperature, using consistent disk preparation and a separate water-control cup. Counts of floating disks form time curves from which a median rise time and rate index are obtained. The experiment compares limiting-factor patterns and records the dark response alongside the light runs. Oxygen accumulation and consumption provide the link between the visible disk movement and the biological processes. The investigation is aligned with NGSS HS-LS1-5, AP Biology Unit 3, and AP Biology Investigation 5.
Record a light run and its control
Predict whether moving the lamp closer will always halve the median flotation time. Prepare the disks consistently and compare lamp distances while retaining light color, bicarbonate supply, and temperature. Record elapsed time and floating-disk count for the experimental cup and water-only control. Estimate ET50 from the time curve, then compare 1/ET50 using the same time unit in each run.
Use the course image above to locate the lamp and cups; it is a preview of the investigation, not a substitute for collecting a run. After a light comparison, turn the lamp off and record the dark response. Explain how oxygen production and oxygen consumption can account for both observations. For preparation and discussion prompts, read the existing floating leaf-disk investigation guide, then compare cellular respiration.
What you will investigate
This photosynthesis virtual lab uses floating leaf disks to investigate light, carbon supply, temperature, and experimental preparation. Vacuum infiltration replaces gas in the leaf tissue with solution so disks initially sink. Under suitable light conditions, photosynthesis produces oxygen that accumulates in the intercellular spaces and can support flotation. The measured rise is evidence from a defined assay, not a direct count of sugar molecules.
Predict a change in the flotation pattern before moving the lamp or changing the solution. Identify the independent variable and keep the other conditions fixed. The preparation matters: incomplete infiltration can leave gas in a disk before the experimental response begins. A disk that floats too early is not automatically evidence of unusually rapid photosynthesis.
Timing the same endpoint
The course uses the time for the median flotation response, ET50, and compares its reciprocal as a rate measure. Reading a count at a single arbitrary time and measuring a median flotation time are different summaries. Keep the definition and the time units consistent when comparing records.
| Ideal standard setup, lamp distance | Model median flotation time |
|---|---|
| 10 cm | 10.40 min |
| 20 cm | 11.50 min |
| 40 cm | 26.95 min |
These values use the prompt's standard 25°C, 0.2% solution, white LED, detergent, and the stated infiltration procedure. The table is an ideal model comparison. A physical leaf sample, different preparation, or different lamp does not inherit these exact timings. Attach the setup to the record before interpreting the trend.
Limiting factors and controlled light comparisons
The nearer lamp supplies greater modeled light intensity, but the response saturates. Moving the lamp closer does not guarantee a proportional increase in the reciprocal timing. When another factor limits the process, additional light can have a smaller effect. The course similarly compares bicarbonate concentration and temperature so that the light-only explanation is not generalized beyond its conditions.
Lamp choice can also change heating. A light-distance experiment that simultaneously changes water temperature needs more careful interpretation than one with a controlled temperature. Explain which variable the assay actually isolated. The water-only control helps identify the role of the modeled inorganic-carbon supply rather than treating illumination as the only requirement.
For comparisons among light colors, match the photon flux at the leaf disks. Identical lamp settings or similar visual brightness do not establish equal useful light conditions at the tissue. In the course's equal-flux comparison, green light has a lower efficiency but not a zero response. Avoid turning a color comparison into the claim that green light cannot support any photosynthesis.
Net photosynthesis and respiration
The flotation assay reflects oxygen accumulation after opposing processes are considered. The course distinguishes gross photosynthesis, respiration, and net photosynthesis. Turning off the lamp changes that balance; continued respiration can remove accumulated oxygen and eventually allow a disk to sink.
A flotation result alone should therefore not be described as a pure measurement of gross photosynthesis. The same visible behavior also depends on the infiltration history and the amount of gas needed to support the disk. Use the tissue representation to connect a macroscopic count with the processes and preparation that produce it.
Standards and classroom discussion
The course supports NGSS HS-LS1-5 and AP Biology's photosynthesis investigation, with the stated respiration connections. Ask students to distinguish an assay observation from the underlying process, compare an experimental cup with its control, and explain a saturation pattern. Use repeated records to discuss variation without claiming that the ideal timings are a required result for every leaf. Continue with cellular respiration or diffusion and osmosis.
Build an explanation from your records
Make a prediction before changing the conditions, then record a comparison that actually tests it. Keep the conditions attached to each row: a number without its setup can be misleading even when the arithmetic is correct. Explain what changed, what stayed fixed, and which observation supports your conclusion. If the result differs from your prediction, revise the explanation using the evidence rather than choosing a new answer without a reason.
The reference examples on this page describe the course model or its stated source data. They are not measurements collected from a physical laboratory by the reader. Compare like conditions, keep units visible, and distinguish rounded instrument displays from underlying model quantities. Use the investigation's stated limits when deciding whether a result can be generalized beyond the simulated setup. This guide supports preparation and interpretation; practical laboratory technique and safety training remain separate learning activities.
Common questions
Standards alignment
- NGSS HS-LS1-5
- AP Biology Unit 3
- AP Biology Investigation 5
More Biology labs
- Members
Biology
Diffusion & Osmosis
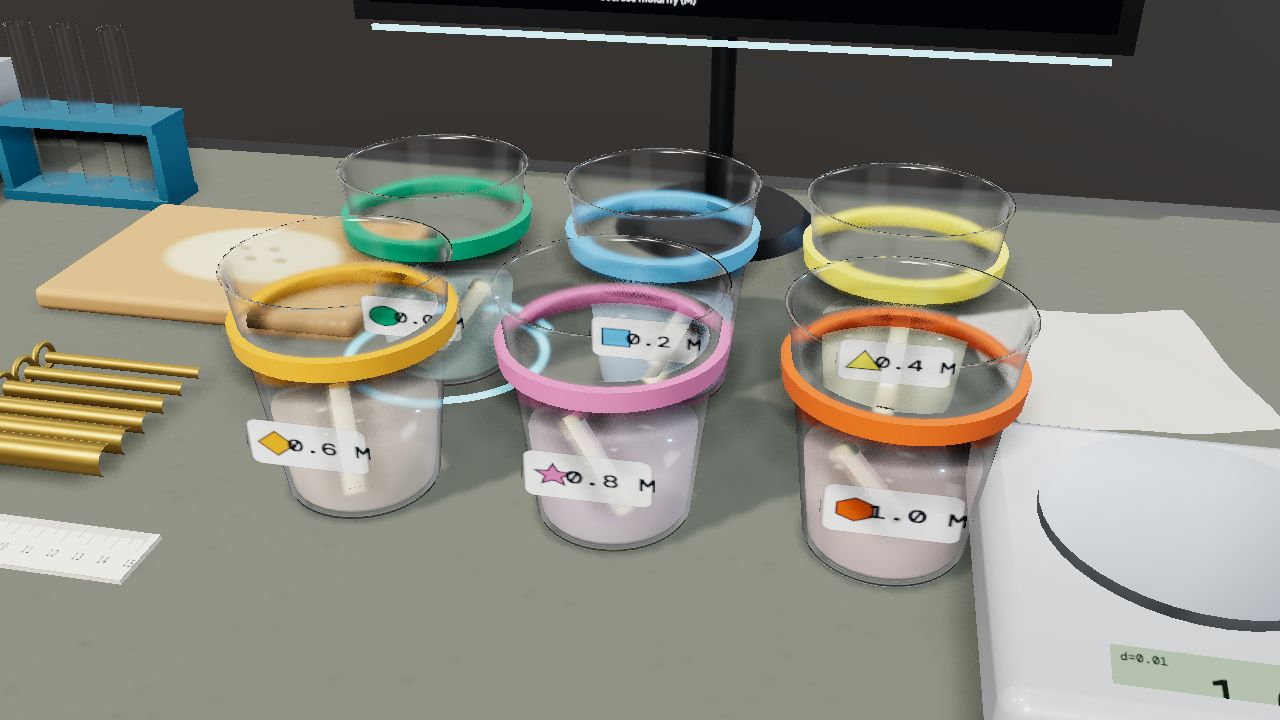
Dialysis bags, potato cores, and onion cells. Where does water go?
- Members
Biology
Enzyme Activity
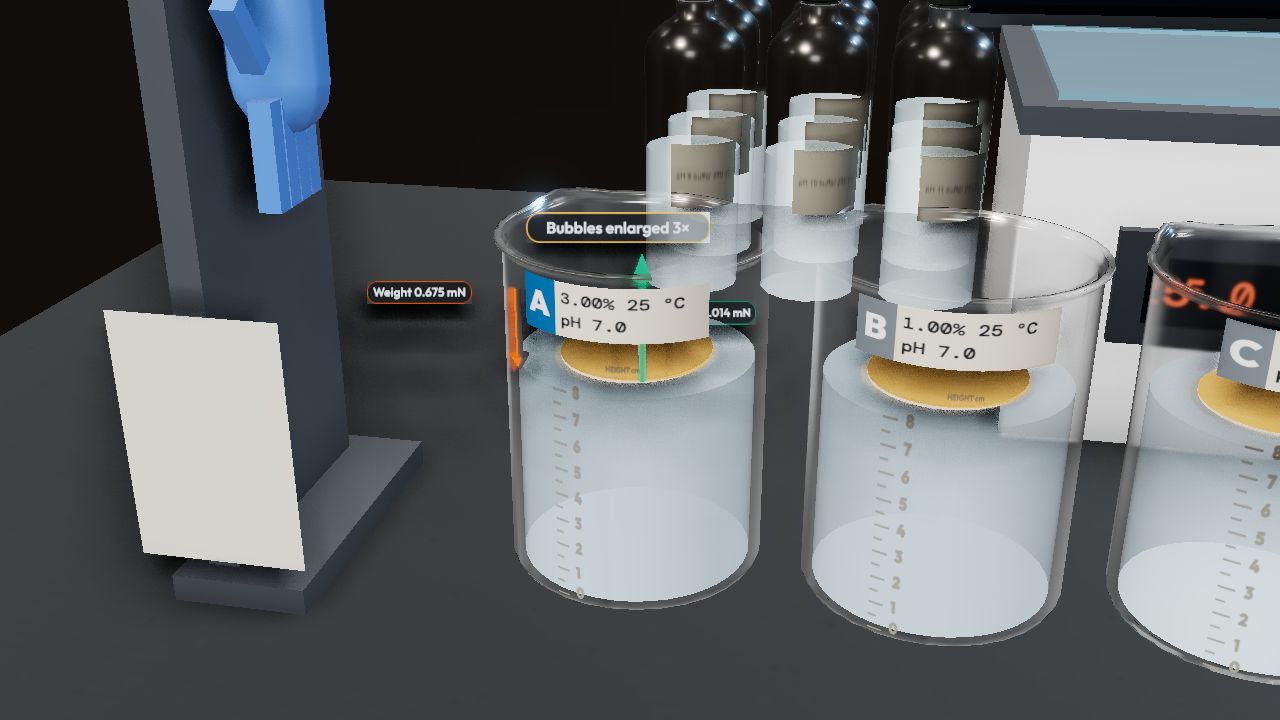
Time a floating disk. Why does heat, pH, or peroxide change the rate?
- Members
Biology
Cells Under the Microscope
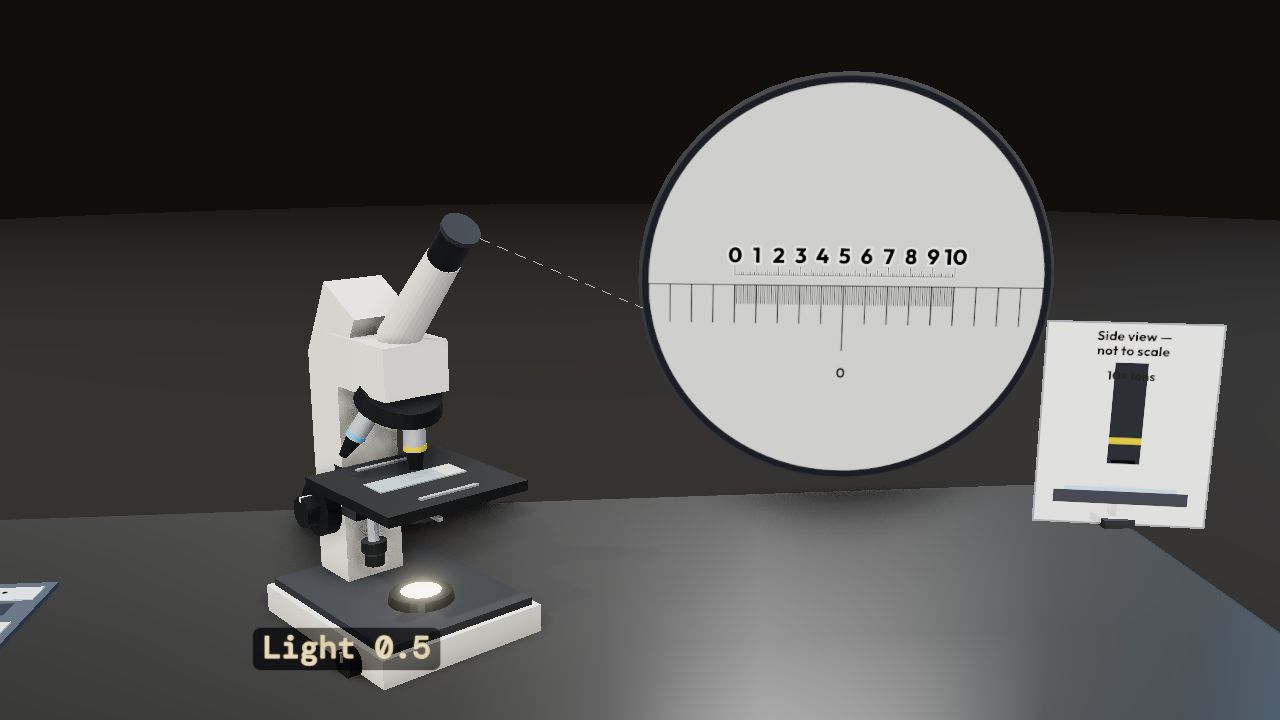
Focus on onion, cheek, and Elodea cells. Then zoom inside to the organelles.


