Chemistry · CHM-001
Acid–Base Titration
One drop, six pH units. Find the equivalence point and pKa.
- NY HS-PS1-11
- AP Chemistry Units 4, 8
- AP Chemistry Investigation 4
- NY Regents “Just a Drop”
Included with a subscription. Create a free account to get started.

About this lab
Deliver base from a burette into an acid sample and record its changing pH. In this interactive 3D investigation for high school students, compare strong and weak acids, control each addition, choose an indicator, and examine the burette meniscus while measuring delivered volume. Titration curves show the initial solution, buffer region, sharp rise, and equivalence region. Concentration calculations use the measured volumes and reaction quantities. A particle display and species account accompany the curves, and the weak-acid investigation includes a half-equivalence measurement of pKa. The experiment is aligned with New York standard HS-PS1-11, AP Chemistry Units 4 and 8, AP Chemistry Investigation 4, and New York Regents required lab “Just a Drop”.
Try a prediction, then test an unknown
Predict whether equal amounts of strong and weak monoprotic acid will need the same delivered base volume. Choose the acid, indicator, and addition size, and retain the base concentration and starting acid volume. Record the initial burette reading before adding base; near the endpoint, compare small additions with the pH curve and particle view.
A useful record has four fields: initial burette reading, final reading, delivered volume, and pH. For the ideal reference below, the 25.00 mL acid sample needs 25.00 mL of 0.100 M base at equivalence. Use those recorded quantities to infer the acid concentration, then explain why the weak-acid curve can reach the same equivalence volume at a different pH. This is a worked model reference; your own run supplies the evidence for your conclusion.
Read the public guide before starting. The course's access button above shows whether sign-in or a subscription is required; a public poster is not an unlocked simulation. For the wider sequence, see virtual chemistry labs or the AP Chemistry collection.
What you will investigate
This virtual titration lab connects careful volume measurement with acid–base reaction stoichiometry and a pH curve. Use a burette to add base to an acid sample, compare indicators, inspect the particle view, and distinguish a visible endpoint from the chemical equivalence point. The investigation includes strong and weak acids, so it can test whether a statement about one curve also holds for another.
Before collecting data, predict the amount of base required and the pH near equivalence. Read the bottom of the meniscus at eye level and determine delivered volume from the final reading minus the initial reading. Slow to individual drops or half-drops near the color change. A larger final burette reading is not by itself the delivered volume unless the initial reading was zero.
Concentration and stoichiometry
For the monoprotic acid and sodium hydroxide examples, equivalence means equal amounts of acid and base have reacted. Use n = MV with matching units. At equivalence, MₐVₐ = MᵦVᵦ for this one-to-one reaction. This relationship counts the acid that can react, rather than only the free hydrogen ions present at the start. Equal volumes and concentrations of a strong and a weak monoprotic acid can therefore require the same amount of base even though their initial pH values differ.
The ideal validation examples use 25.00 mL of 0.100 M acid and 0.100 M sodium hydroxide. Both reach equivalence at 25.00 mL of added base. Their curves differ because acid strength and the species in solution affect equilibrium throughout the titration.
| Added NaOH | Ideal HCl pH | Ideal acetic-acid pH |
|---|---|---|
| 0.00 mL | 1.000 | 2.881 |
| 12.50 mL | 1.477 | 4.757 |
| 24.90 mL | 3.698 | 7.153 |
| 25.00 mL | 7.000 | 8.728 |
These values are ideal equilibrium model references. They should not be described as a guarantee that a rapidly changing probe display immediately reaches equilibrium. The Real mode includes probe response and measurement effects that can make an observed curve differ from the ideal table.
Why indicator choice matters
An indicator changes over a pH range. Equivalence is a stoichiometric condition, whereas an endpoint is the chosen observable color condition. For the course's 0.100 M acetic-acid example, the defined endpoint volumes are 1.149 mL for methyl orange, 24.513 mL for bromothymol blue, 24.898 mL for phenol red, and 25.000 mL for phenolphthalein. Compare those values with the same 25.00 mL equivalence volume before selecting an indicator.
The comparison explains why every indicator should not be treated as a pH 7 detector. A weak-acid equivalence solution contains conjugate base, which can react with water and produce hydroxide. Its equivalence pH is therefore above 7 in this example. The particle view connects that explanation to the chemical species remaining in solution rather than presenting the curve shape as something to memorize.
Half-equivalence and experimental error
At half-equivalence for the acetic-acid example, the curve gives pH 4.757. Relate this point to comparable amounts of acid and conjugate base and the Henderson–Hasselbalch relationship. Keep the amount added separate from the total solution volume when identifying this point. Adding water to the flask changes concentration but does not add more acid molecules that require neutralization.
In Real mode, examine burette reading, drop size, titrant concentration, probe calibration, response lag, and activity effects. Repeated trials can reveal scatter but do not automatically remove a systematic concentration error. Explain whether a particular error would make the calculated acid concentration too high, too low, or unchanged; support the direction using the measured volume and stoichiometric calculation.
Standards and classroom discussion
The course supports NGSS HS-PS1-7, New York HS-PS1-11, and AP Chemistry acid–base and titration topics. A classroom comparison can pair strong- and weak-acid curves with the same initial amount, then ask students to distinguish neutralization capacity from acid strength. Another discussion can compare several indicator endpoints on one curve and defend a choice using the data.
This is an educational equilibrium and measurement model. Its ideal table, rounded instrument readings, and Real-mode variations have different roles in an explanation. Use the simulation to prepare a procedure and interpret evidence; it does not replace practical handling or safety instruction. Continue with electrochemical cells for another comparison of chemical measurements and particle-level explanations.
Common questions
Standards alignment
- NY HS-PS1-11
- AP Chemistry Units 4, 8
- AP Chemistry Investigation 4
- NY Regents “Just a Drop”
More Chemistry labs
- Members
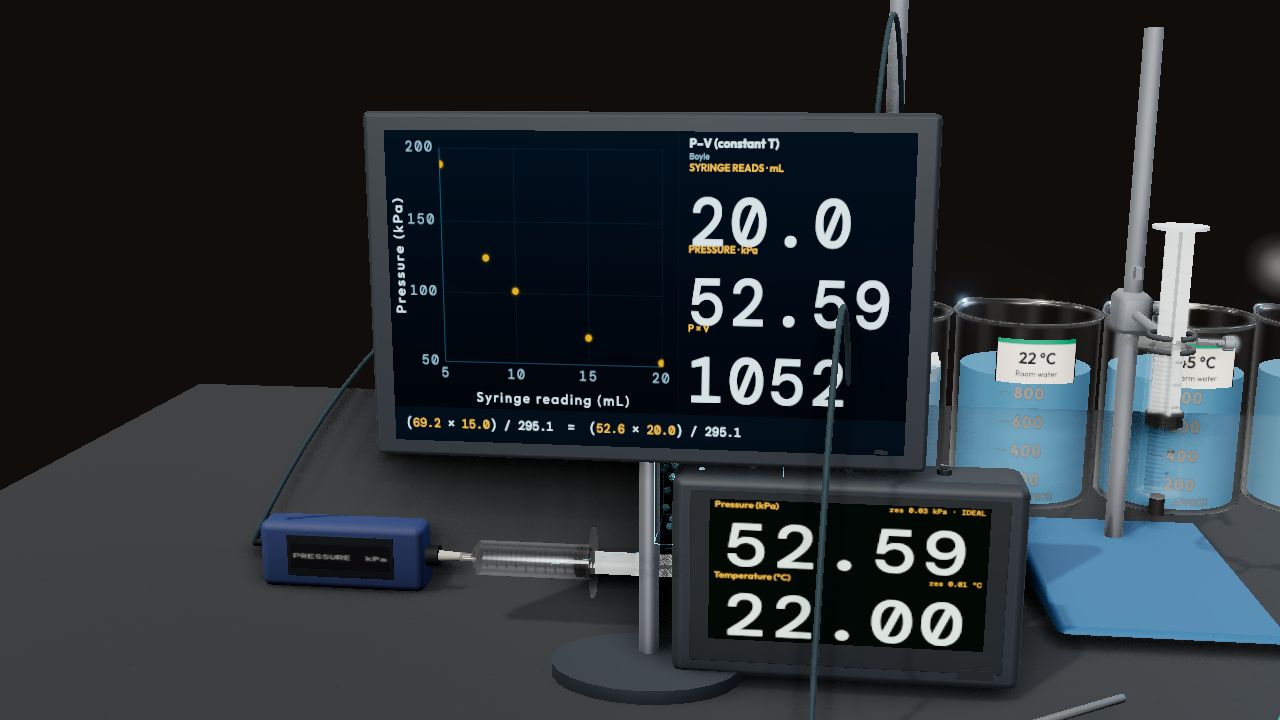
Chemistry
Gas Laws
Squeeze, warm, and cool trapped air. Find absolute zero.
- Members
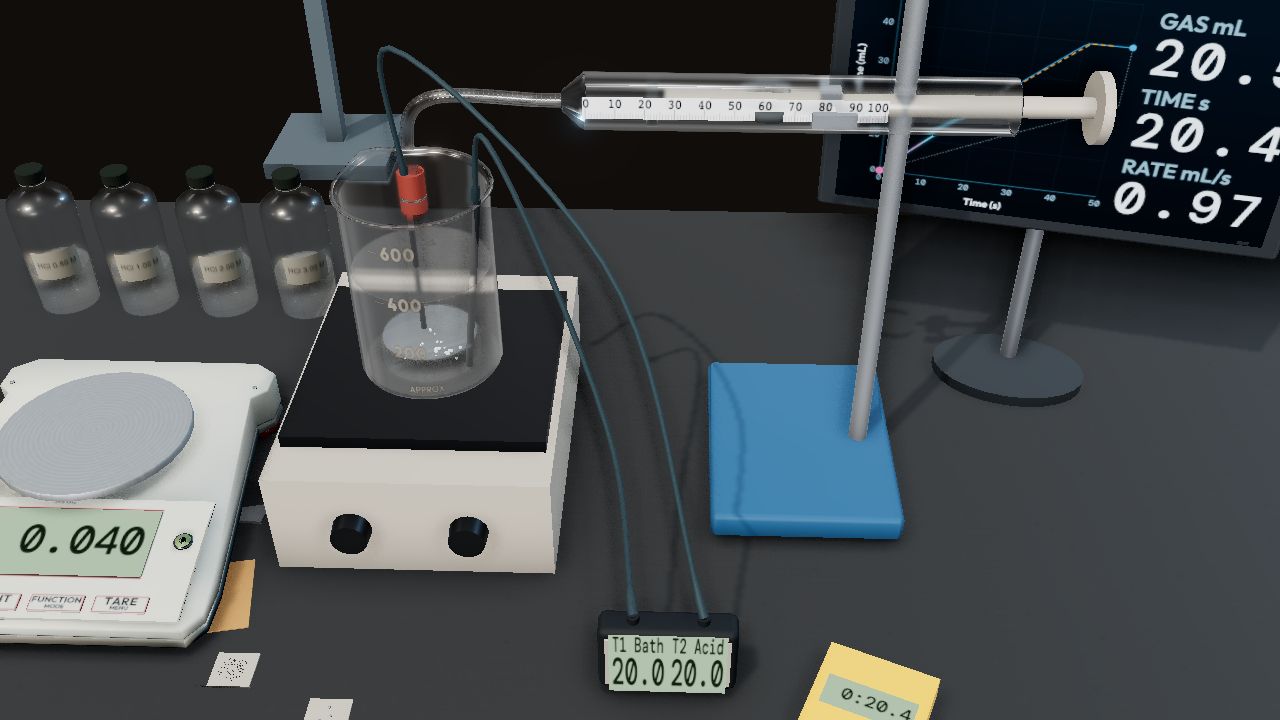
Chemistry
Reaction Rates
Magnesium in acid: change one condition, time the gas.
- Members
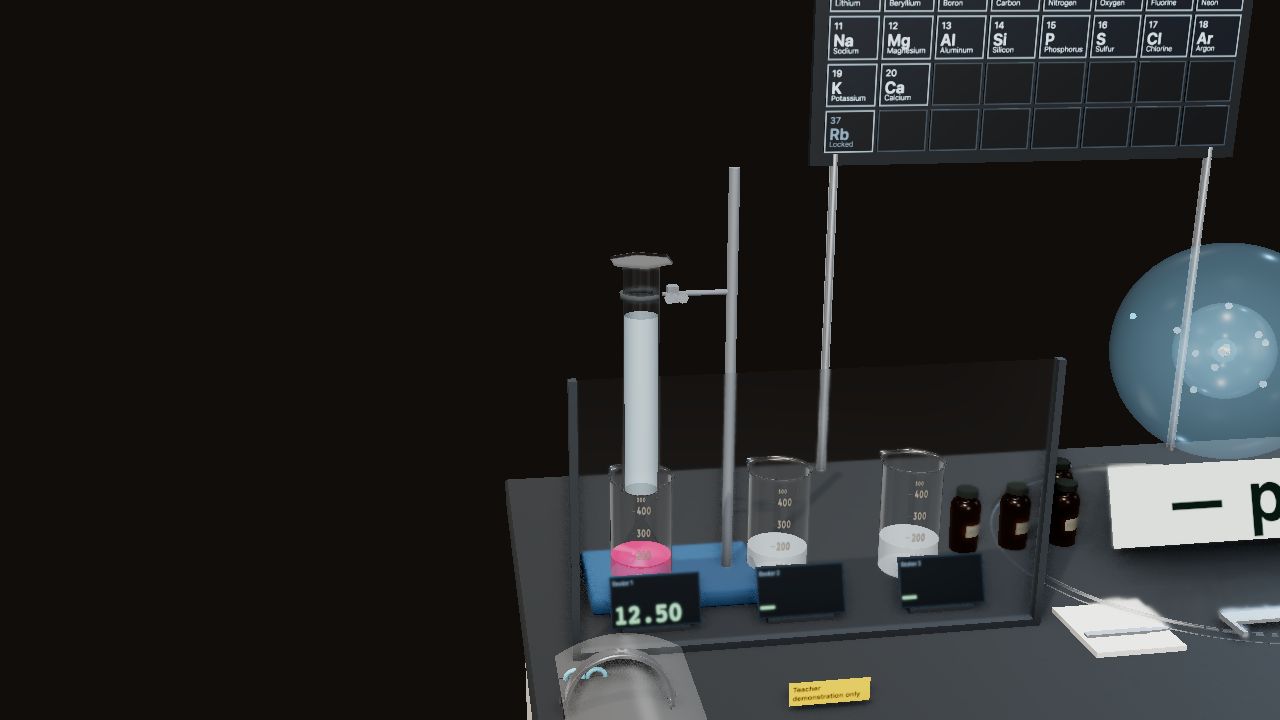
Chemistry
Periodic Trends & Reactivity
Drop lithium, sodium, and potassium into water, then pull electrons off their atoms. What explains what you see?


