Earth Science · ESS-014
Albedo & Ice Feedback
Shine a lamp on ice, dark soil, and water. Why does melting speed up melting?
- NGSS HS-ESS2-2
- AP Environmental Science Unit 9
Included with a subscription. Create a free account to get started.

About this lab
Measure surface reflectivity and follow melting ice before inspecting an Arctic sea-ice record. In this interactive 3D investigation for high school students, choose the ice, soil, or water sample, compare the floating-ice tray backgrounds, and select observation years and seasons in the satellite-data station. Incident and reflected-light measurements accompany temperature and coverage curves. A light-energy account follows the changing surface through warming and melting, while the data station supplies March and September extent comparisons. The investigation connects the tabletop observations with the seasonal record using the measured reflectivity and energy transfers of each setup. The investigation is aligned with NGSS HS-ESS2-2 and AP Environmental Science Unit 9.
What this investigation asks
A dark surface can absorb more incident light without warming more quickly than a brighter material if their heat storage differs. This investigation connects albedo measurements, temperature traces, melting, and a feedback comparison. Begin by distinguishing reflected fraction from absorbed energy and temperature response. The goal is to explain why an ice-covered surface can change its own later absorption as it melts, while also recognizing that water's thermal capacity and ice's phase-change energy make a simple hottest-means-most-absorbing ranking unreliable in the selected apparatus.
Design and measure the comparison
Compare ice, soil, and water under matched lamp conditions, recording reflected light and temperature separately. Use reflected divided by incident light for the albedo estimate and retain the measurement geometry. Follow the ice-covered tray as the fraction exposed changes. Compare a dark exposed surface with the course's light-colored control. The feedback requires that melting reveals a surface absorbing more than the ice. A tray with a different exposed background can therefore test the causal condition rather than simply serving as another object that happens to melt under the same lamp.
Connect the record to the model
Use heat capacity and latent heat to interpret the temperature record. Water can store substantial energy with a smaller short-term rise, while energy entering melting ice can change phase at a steady temperature. For partial ice cover, combine the represented surface fractions to estimate mean albedo under the stated model. Lower ice cover can increase absorption, accelerating further melt in the dark-background comparison. That positive feedback describes reinforcement, not a value judgment or a claim that no other processes can oppose the change in a larger climate system.
Interpret the evidence and its limits
Compare the course's selected sea-ice record by season, retaining the baseline intervals and the distinction between extent and a volume measure. The floating-ice model does not imply a direct sea-level rise from melting the already floating ice itself. Lamp-tray dynamics and Arctic observations occupy different scales and cannot share a single literal time conversion without a model. A final explanation should connect reflected fraction, energy storage, changing cover, and the control result, then state which historical comparison supports a trend without promoting one tabletop response to a complete forecast of future ice conditions.
Reference conditions and quantities
For the specified matched lamp-tray reference, absorbed powers are 2.3625 W for ice, 6.0750 W for soil, and 6.2775 W for water. These are energy-transfer rates, not temperature rises. The temperature and melting response also depend on storage and phase change, so the largest absorbed-power value does not by itself identify the fastest-warming sample.
Use the record to test your explanation
Write a prediction before collecting the comparison, naming the quantity that should change and the condition you will alter. Keep a reference run and vary one factor at a time when the question calls for a controlled test. Record the selected apparatus settings, units, and measurement interval. Where an activity supplies Ideal and Real modes or seeded variation, retain that identity with each record rather than mixing incompatible runs in one calculation.
Separate an instrument reading or counted observation from the model relationship used to explain it. Keep raw values alongside derived results so another student can reconstruct the argument. A graph needs labeled axes and a stated comparison range. If a result differs from a reference, inspect the conditions, rounding, and measurement procedure before changing the explanation.
For a classroom discussion, compare claims supported by the same evidence and identify an additional measurement that would distinguish competing accounts. Finish with a claim, the relevant observations, and reasoning tied to this course's model. State a specific limitation instead of assigning a general error label to every disagreement.
Related investigations
Inspect the planetary energy model in Greenhouse Effect, then compare latent-heat accounting in Heating Curves. Keep incident flux, reflected fraction, temperature change, and phase transformation as distinct steps in the causal account.
Common questions
Standards alignment
- NGSS HS-ESS2-2
- AP Environmental Science Unit 9
More Earth Science labs
- Members
Earth Science
Earthquake Epicenter
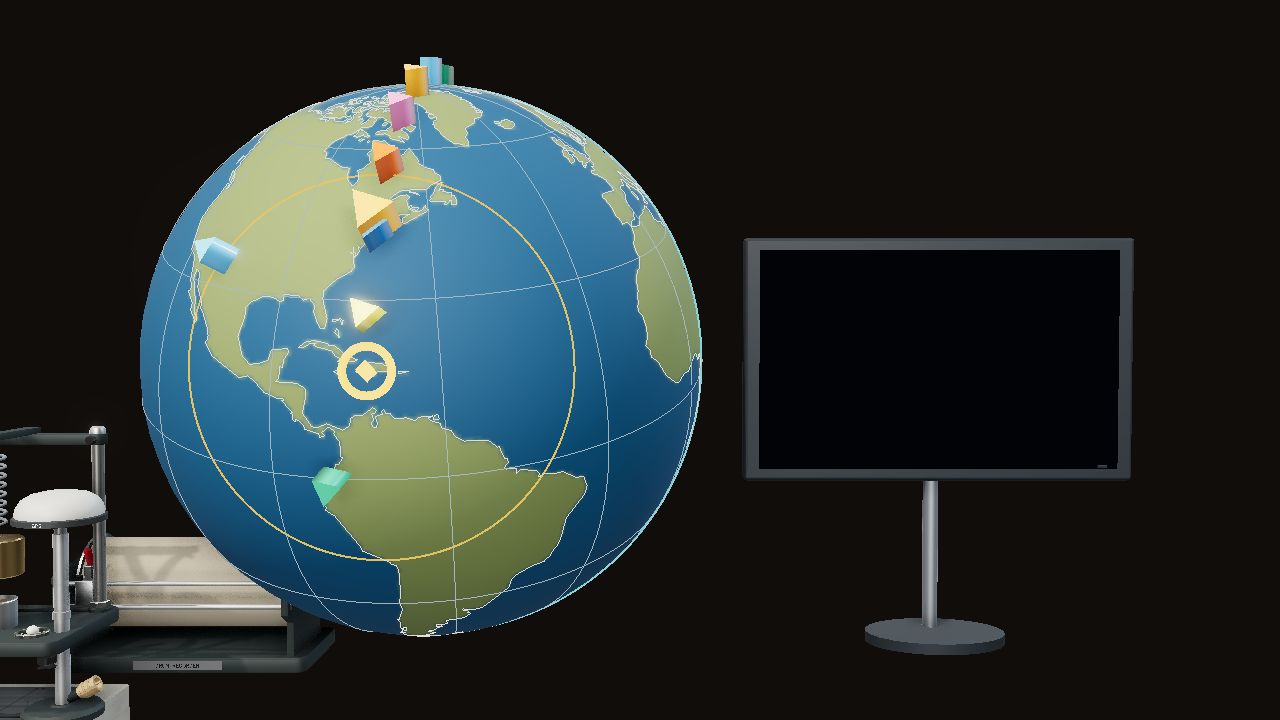
Seismometers find where a quake started — and what lies deep inside Earth.
- Members
Earth Science
Seafloor Spreading & Plate Boundaries
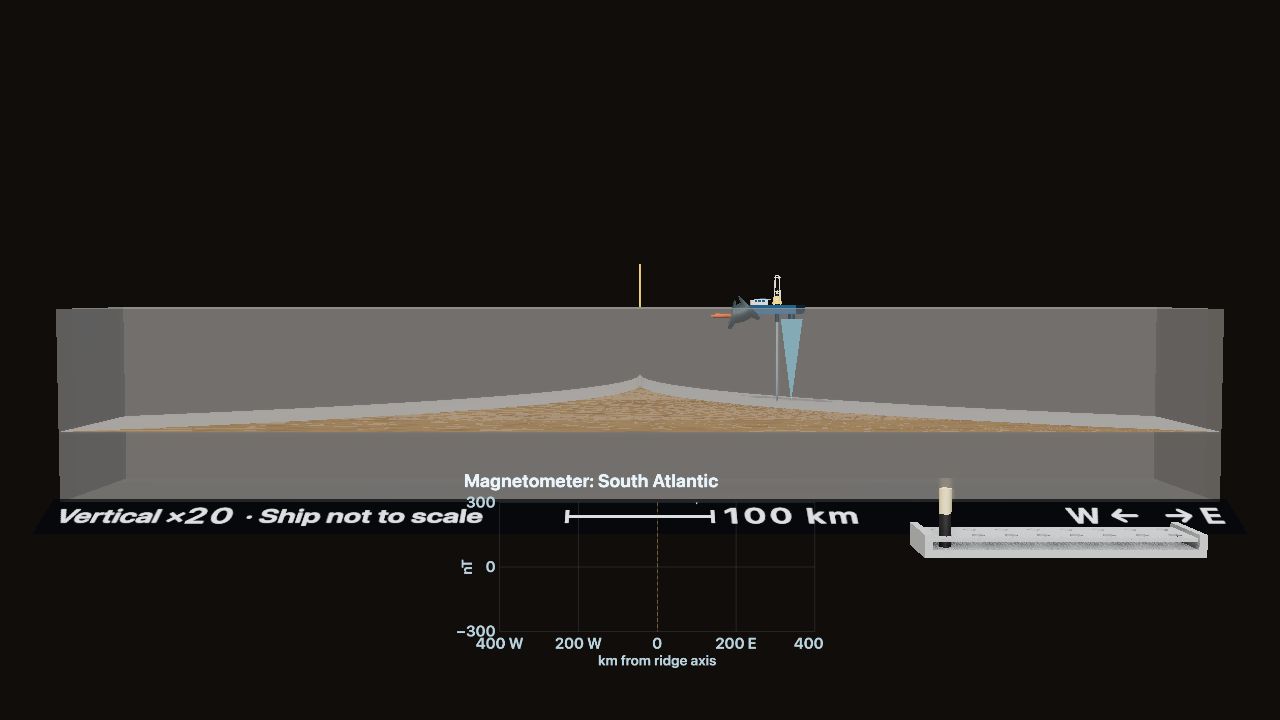
Tow a magnetometer and drill cores across a mid-ocean ridge. What record do the seafloor rocks keep?
- Members
Earth Science
Mineral & Rock Identification
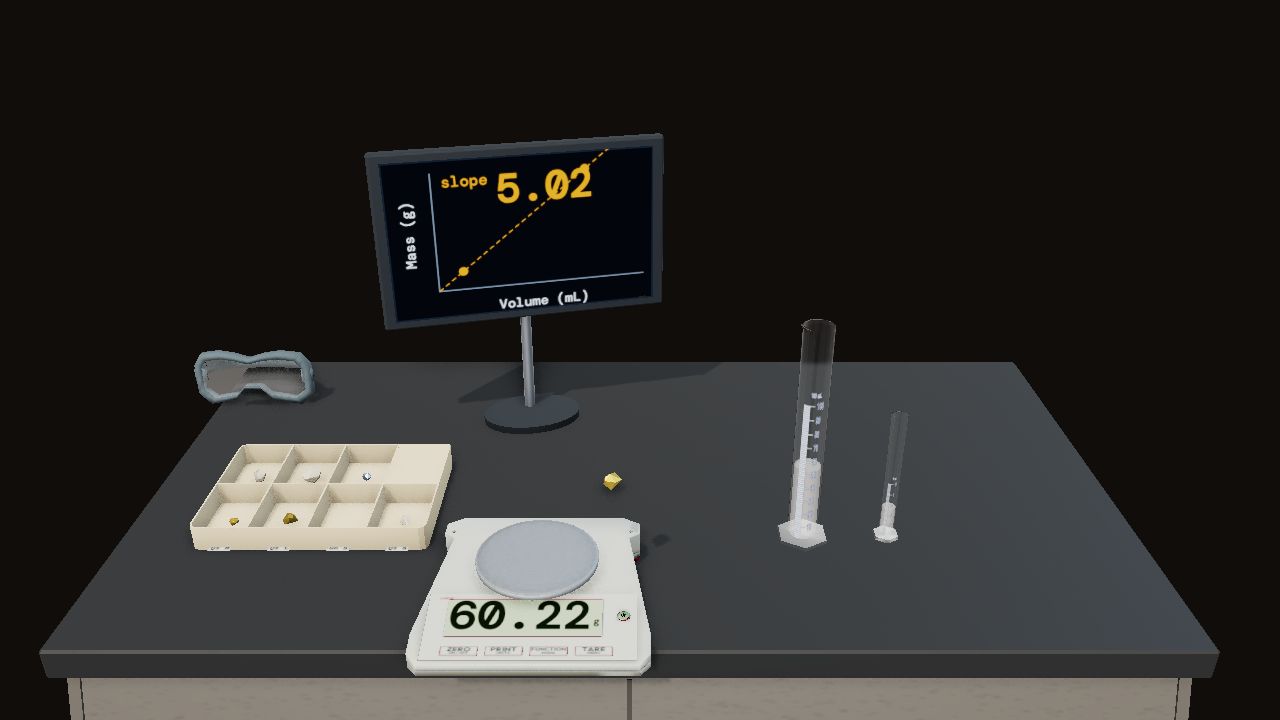
Scratch, streak, and split unknown specimens. Name the mineral, then the rock.


