Environmental · ENV-001
Quadrats & Biodiversity
Throw quadrats in a meadow and a lawn. Which is more diverse, and how sure are you?
- NGSS HS-LS2-2
- AP Environmental Science Units 1, 2
Included with a subscription. Create a free account to get started.

About this lab
Count plants in quadrats and compare the meadow and lawn using several sampling approaches. In this interactive 3D investigation for high school students, place frames at selected or random positions, inspect individual species, compare a dense-patch sample, and investigate the supplied species-removal scenario. Quadrat records provide abundance tallies, richness, and diversity calculations. Repeated-frame summaries add uncertainty, while an accumulation curve tracks the species found as sampling continues. The close-up guide supports identification in each frame, and the later census supplies a broader comparison for evaluating the sampling evidence from the two sites. The investigation is aligned with NGSS HS-LS2-2 and AP Environmental Science Units 1 and 2.
What you will investigate
This biodiversity sampling lab compares a constructed meadow community with a maintained lawn. Place quadrats, count individuals by species, and use the resulting records to distinguish abundance, species richness, and evenness. A site can contain many plants without containing many species. It can also contain several species while one dominates nearly every sample. Those possibilities are why a single total count is not a complete description of diversity.
The course asks you to predict how evenness affects a diversity index and how sampling location affects the evidence. Compare random sampling with deliberately sampling a patch. The plant community is a teaching construction with specified composition and density, not a field survey claiming to represent every meadow or lawn. Your task is to evaluate the evidence within that construction and explain how the sampling method shapes the conclusion.
Richness and Simpson diversity
Richness S counts the species represented. Total abundance N counts all individuals. The course uses Simpson diversity D = 1 − Σ(n/N)², where n is the count for an individual species. A higher value reflects a less concentrated distribution of individuals among species under this definition. State the definition explicitly because similarly named Simpson measures can use a different convention.
| Ideal opening quadrat | Individuals N | Species S | Displayed D |
|---|---|---|---|
| Lawn at the specified opening location | 46 | 4 | 0.31 |
| Meadow at the specified opening location | 24 | 4 | 0.74 |
Both samples contain the same number of species, but their relative abundances differ. The meadow sample's higher index is therefore not explained by its species count alone. Nor does the lawn sample's greater number of individuals establish greater diversity. These are reference values for the two defined opening quadrats, not averages over every possible location.
Sampling and uncertainty
Random placement helps avoid selecting only the visually interesting patch. Directed placement can overrepresent a locally abundant species. However, the result of a particular directed sample depends on its location; do not memorize a claim that the bias must always have the same sign. Compare the actual combined counts and explain which part of the community each method represented.
Use the species accumulation curve to ask whether additional samples are still finding species. The course also compares mean quadrat indices with uncertainty bars. A mean of quadrat indices and an index calculated from pooled counts answer different questions. Keep the calculation method visible when comparing the two sites. A single quadrat is useful evidence about its small area, but it should not be presented as a complete census.
Change in a community is not a recovery forecast
The removal scenario asks what immediately remains if the most common species disappears from each constructed community. Interpret it as a composition and survival comparison. It does not simulate the later recovery of the ecosystem or prove that a more diverse site always recovers faster. The discussion of keystone species further distinguishes a species' ecological role from its numerical abundance.
Standards and classroom discussion
The main connection is NGSS HS-LS2-2, with AP Environmental Science diversity and selected ecosystem topics. Ask students to compare richness, abundance, evenness, and sampling uncertainty in one explanation. A second discussion can separate an immediate removal result from a claim about succession or long-term resilience. Continue with natural selection or population genetics to investigate biological change at another level.
Build an explanation from your records
Make a prediction before changing the conditions, then record a comparison that actually tests it. Keep the conditions attached to each row: a number without its setup can be misleading even when the arithmetic is correct. Explain what changed, what stayed fixed, and which observation supports your conclusion. If the result differs from your prediction, revise the explanation using the evidence rather than choosing a new answer without a reason.
The reference examples on this page describe the course model or its stated source data. They are not measurements collected from a physical laboratory by the reader. Compare like conditions, keep units visible, and distinguish rounded instrument displays from underlying model quantities. Use the investigation's stated limits when deciding whether a result can be generalized beyond the simulated setup. This guide supports preparation and interpretation; practical laboratory technique and safety training remain separate learning activities.
Common questions
Standards alignment
- NGSS HS-LS2-2
- AP Environmental Science Units 1, 2
More Environmental labs
- Members
Environmental
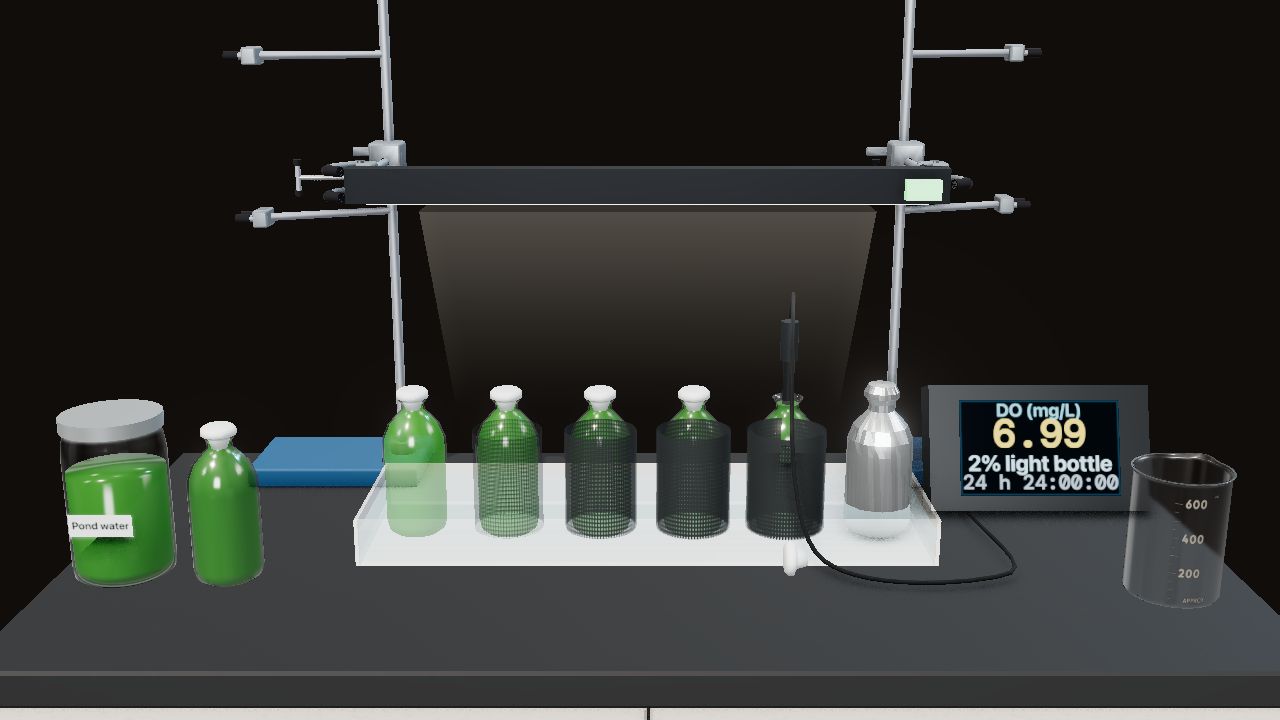
Primary Productivity
Light and dark bottles of pond water. How much oxygen do the algae make?
- Members
Environmental
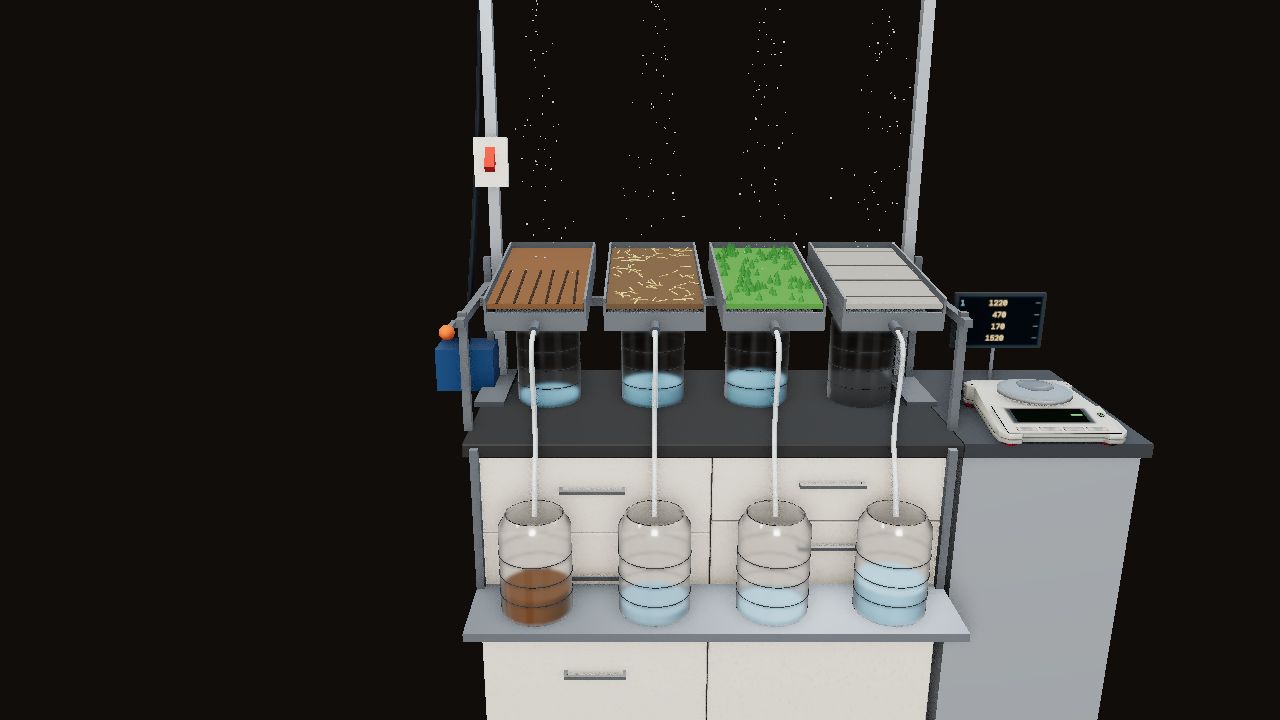
Watersheds, Runoff & Land Use
Rain on a landscape model. Clear it, plow it, terrace it, pave it, and rain again. Where does the water go?
- Members
Environmental
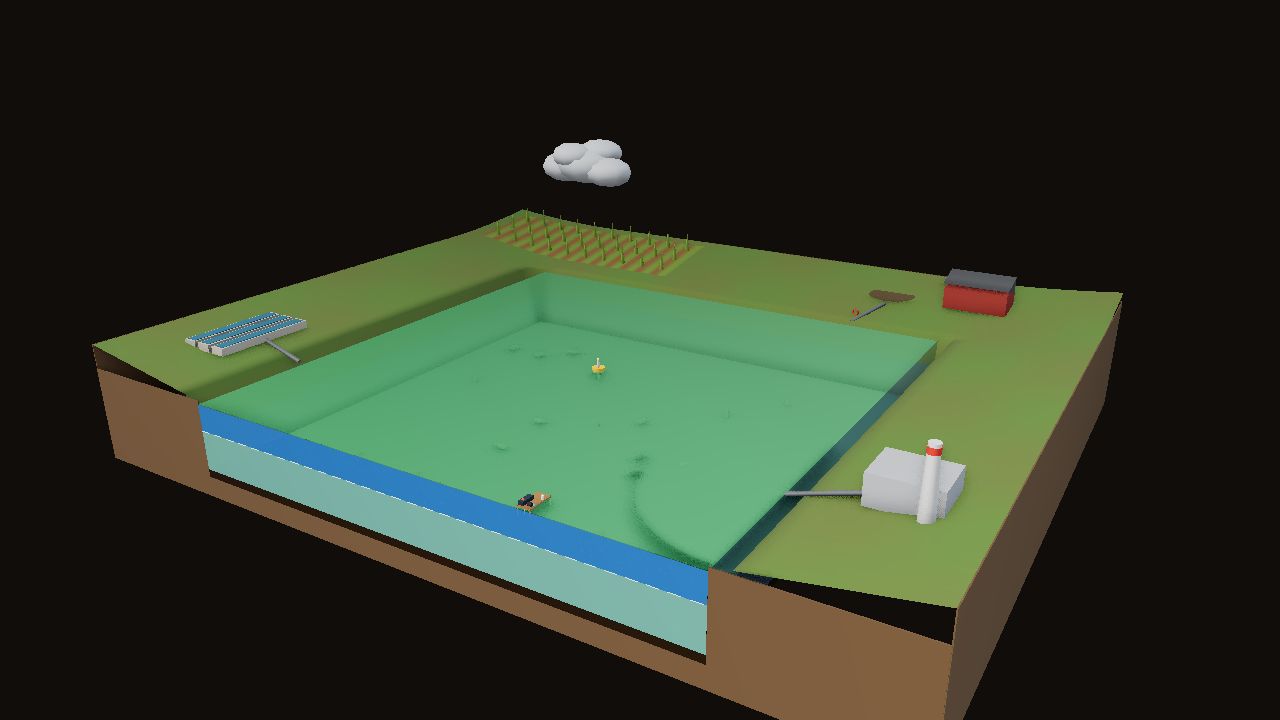
Water Quality & Eutrophication
Add fertilizer or farm waste to a pond model. Follow the algae bloom to the fish kill, and test for coliforms.


