Environmental · ENV-002
Primary Productivity
Light and dark bottles of pond water. How much oxygen do the algae make?
- AP Environmental Science Unit 1
Included with a subscription. Create a free account to get started.

About this lab
Incubate screened light bottles and a dark bottle and compare their dissolved-oxygen measurements. This interactive 3D experiment lets high school students select the source water and incubation period, prepare the bottle set, measure the initial sample, and read each bottle after the run. Differences between initial, light, and dark observations are expressed per day for the community's respiration and oxygen-production comparisons. The separate producer estimate remains labeled as modeled. A bottle close-up and nominal-depth display accompany the selected reading, connecting illumination with the observed balance while retaining the initial and dark controls. These activities are aligned with AP Environmental Science Unit 1.
What this investigation asks
A change in a community's dissolved oxygen is not automatically equal to the energy stored by its producers. This investigation uses starting, light, and dark bottle measurements to distinguish gross production, community respiration, and community net oxygen change. Begin with the sample, incubation time, and light condition. The goal is to trace which rate each bottle difference supports and which additional model assumptions are needed to estimate producer net productivity. Heterotrophic respiration contributes to the community account, so a single net-oxygen difference does not directly establish producer biomass accumulation.
Design and measure the comparison
Retain the initial oxygen reading and compare matched samples incubated in light and darkness. Divide the appropriate differences by the incubation interval before comparing preparations of different durations. Keep concentration and rate units distinct. The light sample includes photosynthesis and respiration, while the dark comparison constrains respiration under the stated course assumptions. Different water samples have different represented producer and heterotroph amounts. A larger raw oxygen change from a longer incubation is not enough to establish a larger daily productivity rate without the time conversion and sample context.
Connect the record to the model
Use the bottle differences to infer the community respiration and gross production quantities, then separate the producer-specific respiratory estimate used for producer NPP. The course's continuous-light scenarios and selected parameters provide a constructive teaching comparison. Its analytical oxygen-balance reference identifies a condition under those inputs, rather than directly measuring a universal compensation depth in every lake. The oxygen-to-carbon conversion also follows a stated stoichiometric model. Keep that conversion and the biological compartment explicit instead of describing every oxygen increase as a direct weighing of stored biomass or fixed carbon.
Interpret the evidence and its limits
Compare depth or light proportion while holding the other sample conditions fixed, and retain the water-clarity assumption when predicting a shifted reference depth. Different communities can have similar net oxygen change through different gross production and respiration rates. A final explanation should state sample identity, incubation interval, starting and final readings, and the derived community quantities. Identify the extra assumptions behind a producer-storage estimate, and distinguish a matched bottle inference from a full ecosystem production measurement that would need additional spatial, temporal, and biological information.
Reference conditions and quantities
At 20 °C, the course oxygen-saturation reference is 9.0924 mg/L, displayed as 9.09 mg/L. That concentration is a temperature-matched reference, not a productivity rate. A productivity inference requires the appropriate bottle differences divided by incubation time and the stated community or producer accounting assumptions; saturation alone does not establish gross or net production.
Use the record to test your explanation
Write a prediction before collecting the comparison, naming the quantity that should change and the condition you will alter. Keep a reference run and vary one factor at a time when the question calls for a controlled test. Record the selected apparatus settings, units, and measurement interval. Where an activity supplies Ideal and Real modes or seeded variation, retain that identity with each record rather than mixing incompatible runs in one calculation.
Separate an instrument reading or counted observation from the model relationship used to explain it. Keep raw values alongside derived results so another student can reconstruct the argument. A graph needs labeled axes and a stated comparison range. If a result differs from a reference, inspect the conditions, rounding, and measurement procedure before changing the explanation.
For a classroom discussion, compare claims supported by the same evidence and identify an additional measurement that would distinguish competing accounts. Finish with a claim, the relevant observations, and reasoning tied to this course's model. State a specific limitation instead of assigning a general error label to every disagreement.
Related investigations
Connect producer energy accounts in Energy Dynamics, then compare depth-dependent oxygen in Water Quality. Keep saturation concentration, oxygen-change rate, community balance, and producer biomass storage as different quantities throughout the explanation.
Common questions
Standards alignment
- AP Environmental Science Unit 1
More Environmental labs
- Members
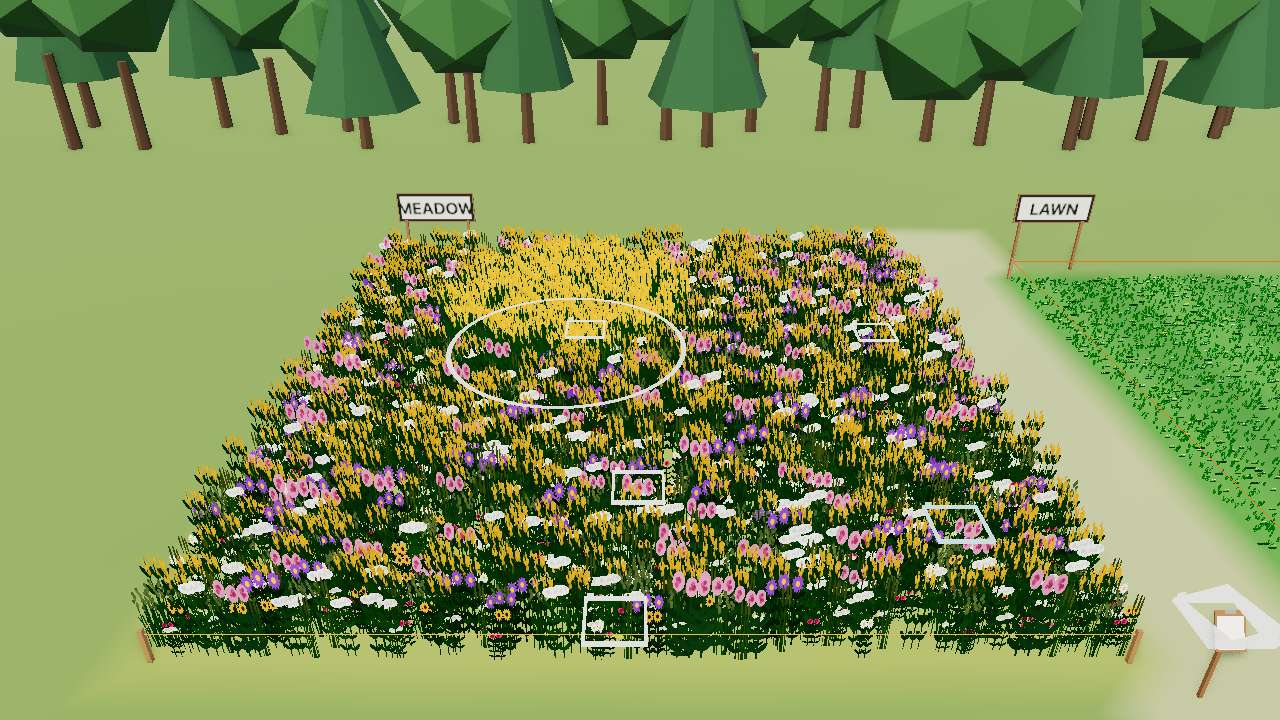
Environmental
Quadrats & Biodiversity
Throw quadrats in a meadow and a lawn. Which is more diverse, and how sure are you?
- Members
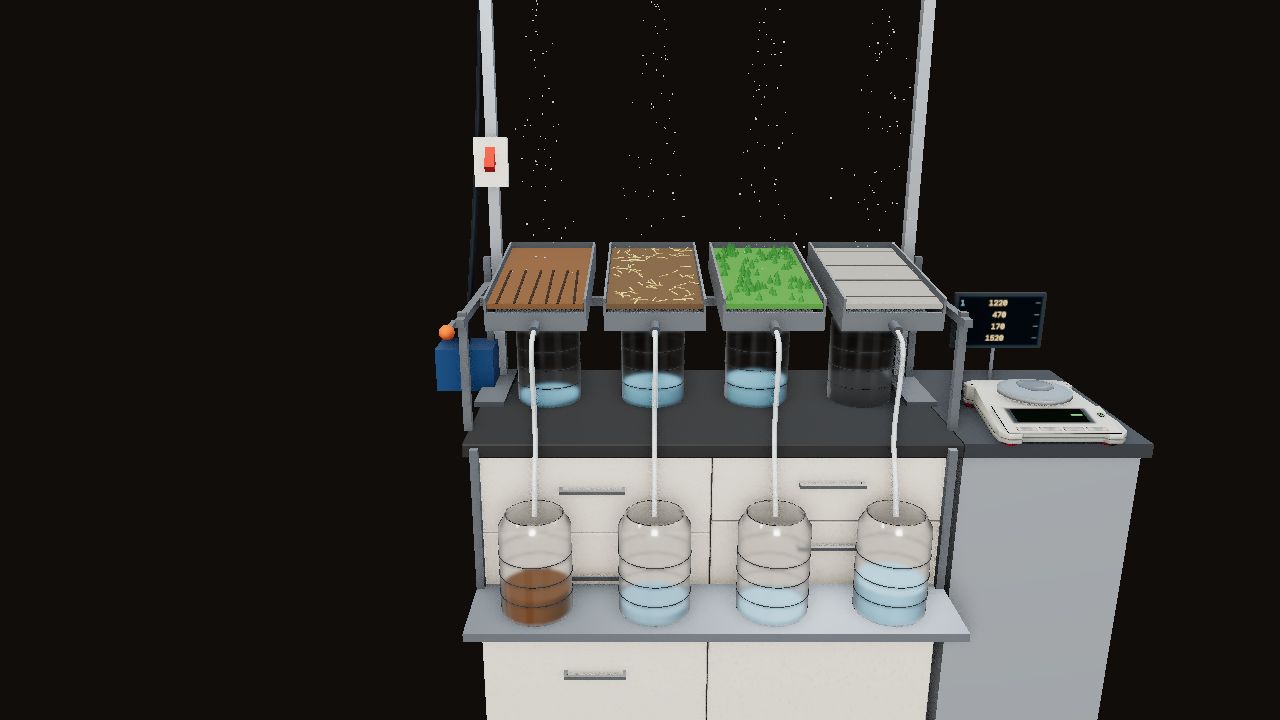
Environmental
Watersheds, Runoff & Land Use
Rain on a landscape model. Clear it, plow it, terrace it, pave it, and rain again. Where does the water go?
- Members
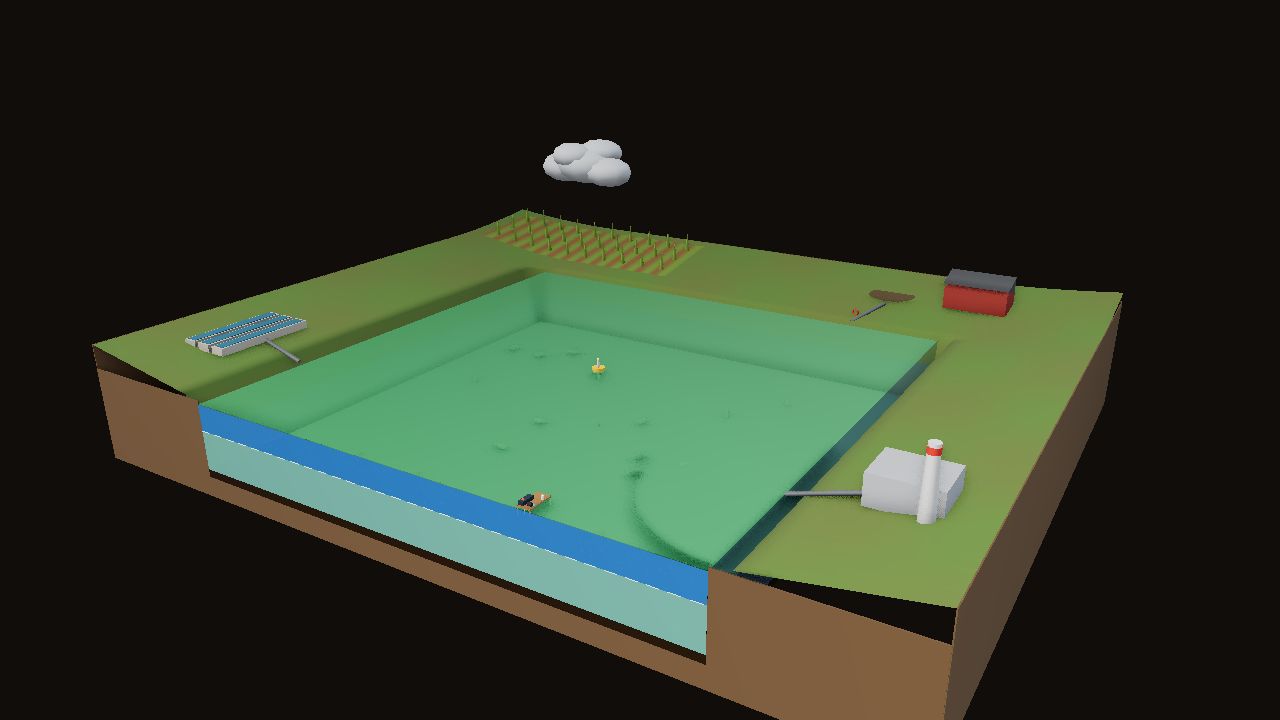
Environmental
Water Quality & Eutrophication
Add fertilizer or farm waste to a pond model. Follow the algae bloom to the fish kill, and test for coliforms.


