Environmental · ENV-003
Watersheds, Runoff & Land Use
Rain on a landscape model. Clear it, plow it, terrace it, pave it, and rain again. Where does the water go?
- AP Environmental Science Units 4, 5, 8
Included with a subscription. Create a free account to get started.

About this lab
Follow stormwater through a watershed model and measure runoff from a set of rainfall trays. High school students use the interactive 3D setup to select land-cover options for the zones, choose a design storm, and compare the four prepared surface treatments under the rainfall procedure. Collection bottles supply runoff and infiltration volumes, with dried sediment added to the tray record. The landscape station reports inflow, sediment delivery, and lake-level response alongside drainage paths. A surface lens follows individual rain movements, connecting local cover observations with the larger modeled storm account and its topographic boundaries. Course topics are aligned with AP Environmental Science Units 4, 5, and 8.
What this investigation asks
A watershed includes the land draining to a shared receiving water body, while a divide separates neighboring drainage paths. This investigation connects terrain, land cover, rainfall, runoff, and sediment delivery. Begin by locating the outlet and following slope rather than treating a map's visible boundary as the drainage divide without elevation evidence. The goal is to evaluate land-use and mitigation scenarios through matched model runs, keeping the water-volume result separate from transported soil and from a general claim about every real watershed with the same land-cover label.
Design and measure the comparison
Use the contour view to infer which outlet receives rain from a selected point, then retain the contributing area. Compare land-use conditions under the same storm and starting model assumptions. Impervious surfaces limit access to soil storage and infiltration, while vegetation and management affect water and sediment pathways differently. The course's rainfall-tray comparisons are constructed teaching scenarios. Record the actual input and output quantities instead of treating a pictured urban surface or exposed soil as sufficient evidence for a specific multiplier in the field.
Connect the record to the model
Follow the rainfall account into modeled storage, infiltration, runoff, and receiving-water volume. Compare event size as well as land cover because the ratio between scenarios can change with the storm input. Sediment delivery uses another mechanism and need not have the same ranking or multiplier as water volume. Mitigations such as terraces, contour planting, rain gardens, and permeable surfaces act at different parts of the path. Evaluate the same stated storm before and after a change so the design comparison answers a consistent question rather than combining a milder storm with an altered surface.
Interpret the evidence and its limits
Retain the course's curve-number and erosion assumptions as model inputs rather than direct observations of every location. A generic mechanism can be supported by literature even when a precise scenario ratio is a selected teaching estimate. Compare a design across the requested water and sediment criteria and acknowledge tradeoffs. A final explanation should identify area, storm, land-use setting, and measured or calculated output, then state which inference belongs to the controlled model. Do not extrapolate a specific tray or watershed ratio into a site forecast without the corresponding soil, rainfall history, topography, and calibration evidence.
Reference conditions and quantities
The course forest scenario uses curve number 55.00 and derived storage parameter 8.1818 in. These are parameters of the specified rainfall-runoff teaching model, not direct measurements of every forest. Retain the storm amount, soil assumptions, and contributing area when interpreting the resulting runoff volume or comparing it with another land-use setting.
Use the record to test your explanation
Write a prediction before collecting the comparison, naming the quantity that should change and the condition you will alter. Keep a reference run and vary one factor at a time when the question calls for a controlled test. Record the selected apparatus settings, units, and measurement interval. Where an activity supplies Ideal and Real modes or seeded variation, retain that identity with each record rather than mixing incompatible runs in one calculation.
Separate an instrument reading or counted observation from the model relationship used to explain it. Keep raw values alongside derived results so another student can reconstruct the argument. A graph needs labeled axes and a stated comparison range. If a result differs from a reference, inspect the conditions, rounding, and measurement procedure before changing the explanation.
For a classroom discussion, compare claims supported by the same evidence and identify an additional measurement that would distinguish competing accounts. Finish with a claim, the relevant observations, and reasoning tied to this course's model. State a specific limitation instead of assigning a general error label to every disagreement.
Related investigations
Review drainage geometry in Topographic Maps, then follow soil-water behavior in Soil & Groundwater. Distinguish terrain routing, infiltration, runoff volume, and sediment delivery when explaining a downstream response to a land-use change.
Common questions
Standards alignment
- AP Environmental Science Units 4, 5, 8
More Environmental labs
- Members
Environmental
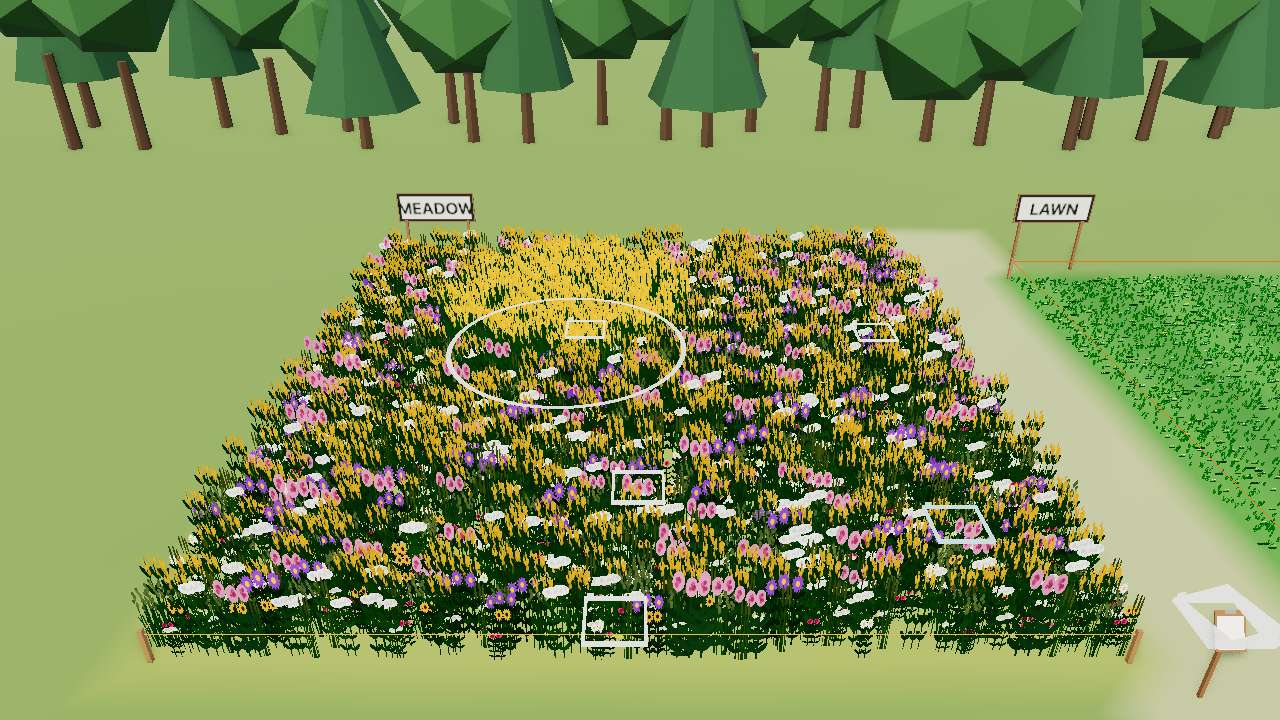
Quadrats & Biodiversity
Throw quadrats in a meadow and a lawn. Which is more diverse, and how sure are you?
- Members
Environmental
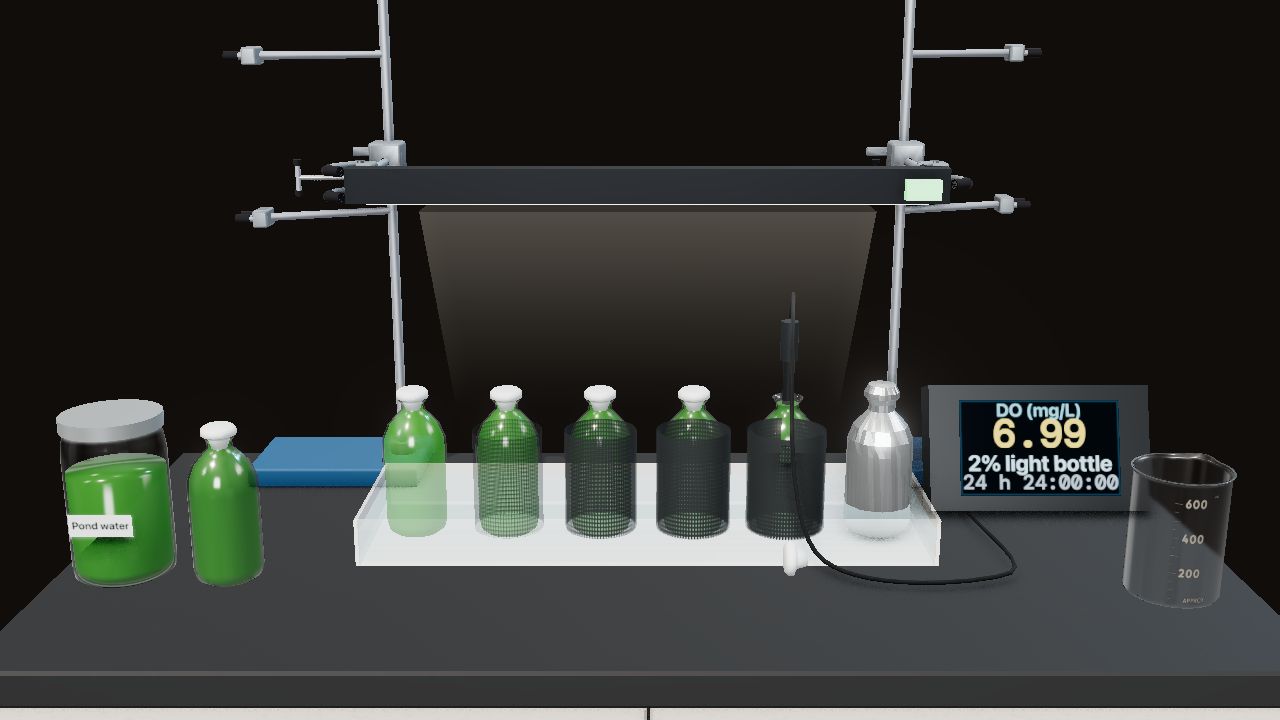
Primary Productivity
Light and dark bottles of pond water. How much oxygen do the algae make?
- Members
Environmental
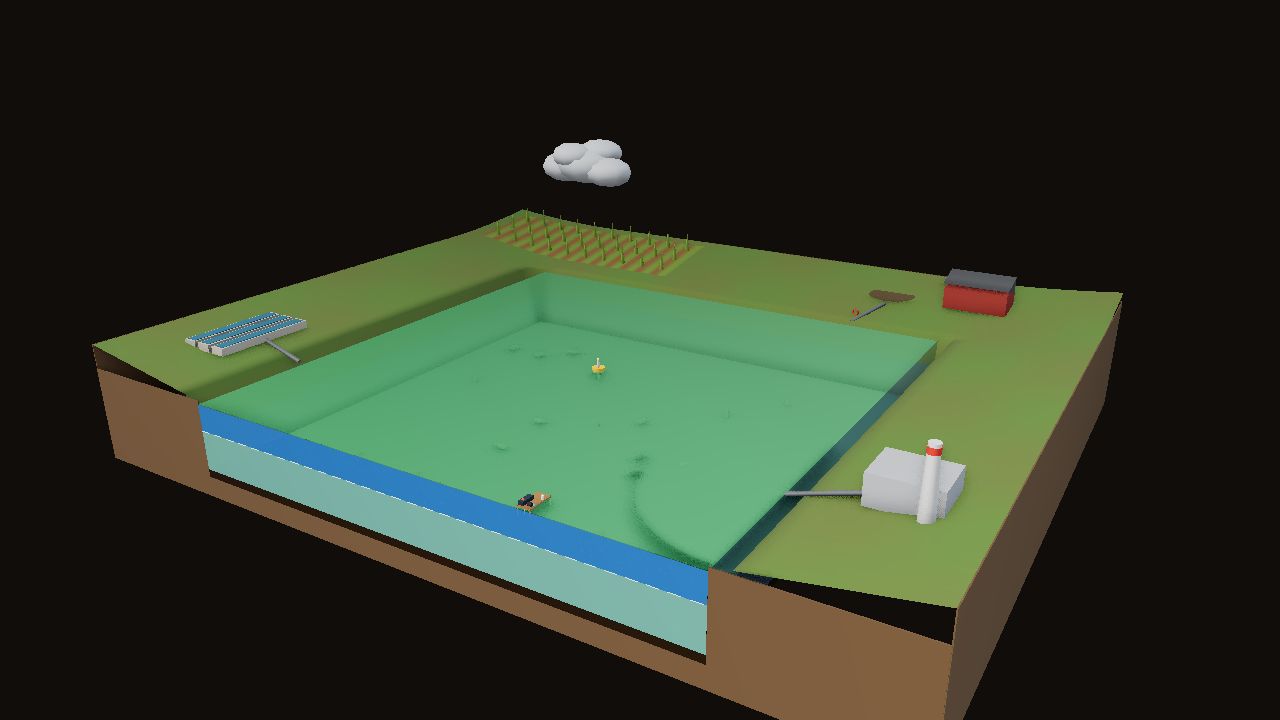
Water Quality & Eutrophication
Add fertilizer or farm waste to a pond model. Follow the algae bloom to the fish kill, and test for coliforms.


