Environmental · ENV-010
Disturbance, Islands & Succession
Burn, flood, or clear a patch of forest, or raise a new island. Watch what arrives and grows back over 100 years.
- NGSS HS-LS2-6
- NGSS HS-LS4-5
- NGSS HS-LS4-6
- NGSS HS-ETS1-4
- AP Environmental Science Units 2, 5, 9
Included with a subscription. Create a free account to get started.

About this lab
Track vegetation after a disturbance and compare island colonization with marsh management outcomes. In this interactive 3D investigation for high school students, apply the forest scenarios, contrast island area and separation, and select or modify a management plan for the invasive plant. Time curves report cover, biomass, species counts, and diversity across the modeled recovery sequence. The island record supplies colonization and loss comparisons, while the marsh assessment uses its stated criteria to compare interventions. Layer views show the dominant vegetation categories alongside the current landscape, connecting each record with its scenario and elapsed time. These activities are aligned with NGSS HS-LS2-6, NGSS HS-LS4-5, NGSS HS-LS4-6, NGSS HS-ETS1-4, and AP Environmental Science Units 2, 5, and 9.
What this investigation asks
A disturbed community's recovery depends on what remains as well as on what was removed. This investigation compares succession after selected disturbances with establishment on a new island and connects abundance, biomass, diversity, and species turnover. Begin by describing soil, seed bank, roots, and other legacies in the scenario. The goal is to explain different trajectories rather than treating every cleared-looking landscape as the same starting state. A return of total biomass does not guarantee that the species identities or relative proportions have returned to the earlier community.
Design and measure the comparison
Compare matched scenarios and retain disturbance type, starting vegetation, and time interval. Record the area or count basis for the selected vegetation classes along with biomass and species information. Primary and secondary succession differ in their available legacies, so the course new-island and post-fire comparisons begin with different conditions. Flooding also selects through the modeled tolerance ranges. A comparison that changes both initial soil and seed availability cannot attribute the entire outcome to a single named disturbance feature without acknowledging those connected differences in the setup.
Connect the record to the model
Use the supplied diversity measure to inspect both richness and relative abundance, keeping its definition and sample basis explicit. The island comparison relates arrival and disappearance rates to the equilibrium species count under the selected area and distance conditions. A stable expected total can coexist with continuing species turnover. Larger or nearer islands can support different balances without their species count scaling one-for-one with area. Connect the modeled rates and legacies to the trajectory, rather than interpreting a visually taller stand as direct evidence of the highest diversity or a finished endpoint in every ecological sense.
Interpret the evidence and its limits
Retain the teaching model's transition and dispersal assumptions when evaluating intervention choices such as replanting or prescribed disturbance. A listed steady distribution is a model expectation, not a guarantee that every finite plot must contain the same classes in exact proportions. Different responses can improve biomass, diversity, or runoff criteria with tradeoffs. A final explanation should state the disturbance legacy, measured outcome, time scale, and relevant rate mechanism, then identify what an additional sample would test. Do not turn one simulated recovery interval into a universal forecast for every real ecosystem affected by the same disturbance label.
Reference conditions and quantities
The course reference transition model has a steady distribution with the final listed vegetation-class fraction 0.793651. That fraction describes the selected transition system and class definition, not the fraction of every disturbed real landscape covered by forest. Retain the starting state and time when comparing a finite-plot count with the model's eventual distribution.
Use the record to test your explanation
Write a prediction before collecting the comparison, naming the quantity that should change and the condition you will alter. Keep a reference run and vary one factor at a time when the question calls for a controlled test. Record the selected apparatus settings, units, and measurement interval. Where an activity supplies Ideal and Real modes or seeded variation, retain that identity with each record rather than mixing incompatible runs in one calculation.
Separate an instrument reading or counted observation from the model relationship used to explain it. Keep raw values alongside derived results so another student can reconstruct the argument. A graph needs labeled axes and a stated comparison range. If a result differs from a reference, inspect the conditions, rounding, and measurement procedure before changing the explanation.
For a classroom discussion, compare claims supported by the same evidence and identify an additional measurement that would distinguish competing accounts. Finish with a claim, the relevant observations, and reasoning tied to this course's model. State a specific limitation instead of assigning a general error label to every disagreement.
Related investigations
Compare community measures in Biodiversity Sampling, then inspect population constraints in Growth & Carrying Capacity. Keep biomass, abundance, richness, relative diversity, and species turnover as different outcomes in a recovery explanation.
Common questions
Standards alignment
- NGSS HS-LS2-6
- NGSS HS-LS4-5
- NGSS HS-LS4-6
- NGSS HS-ETS1-4
- AP Environmental Science Units 2, 5, 9
More Environmental labs
- Members
Environmental
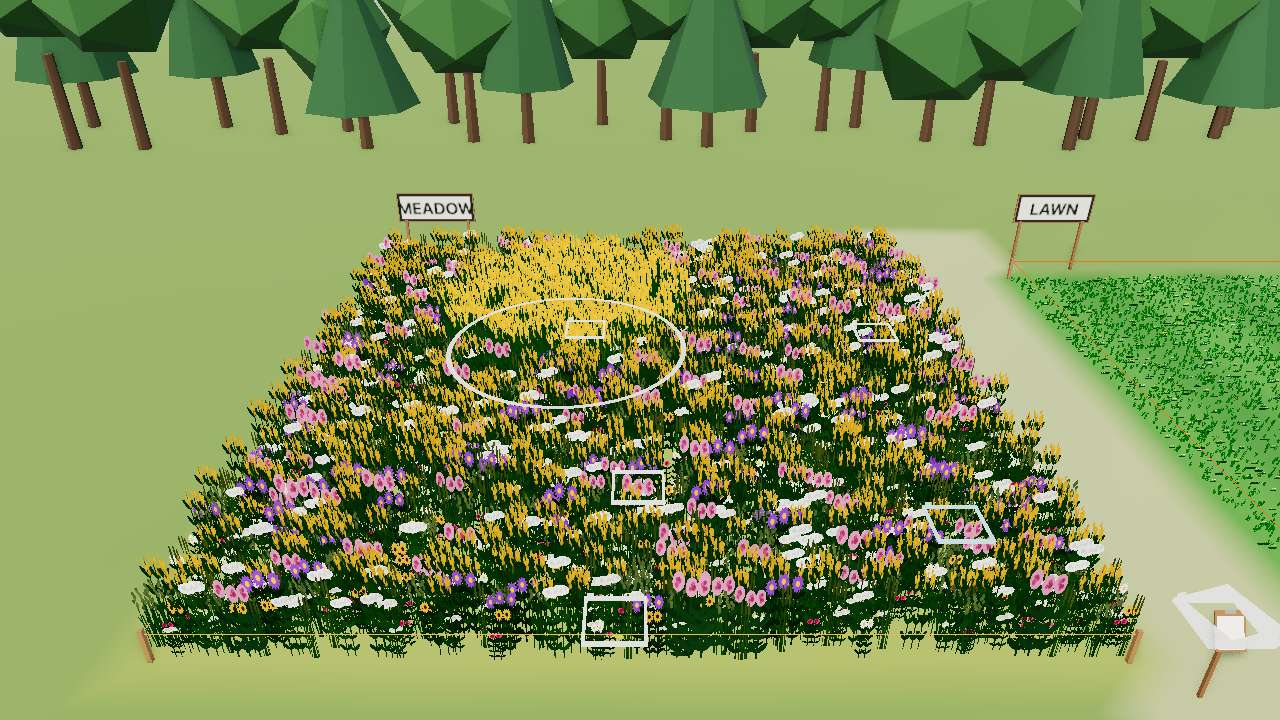
Quadrats & Biodiversity
Throw quadrats in a meadow and a lawn. Which is more diverse, and how sure are you?
- Members
Environmental
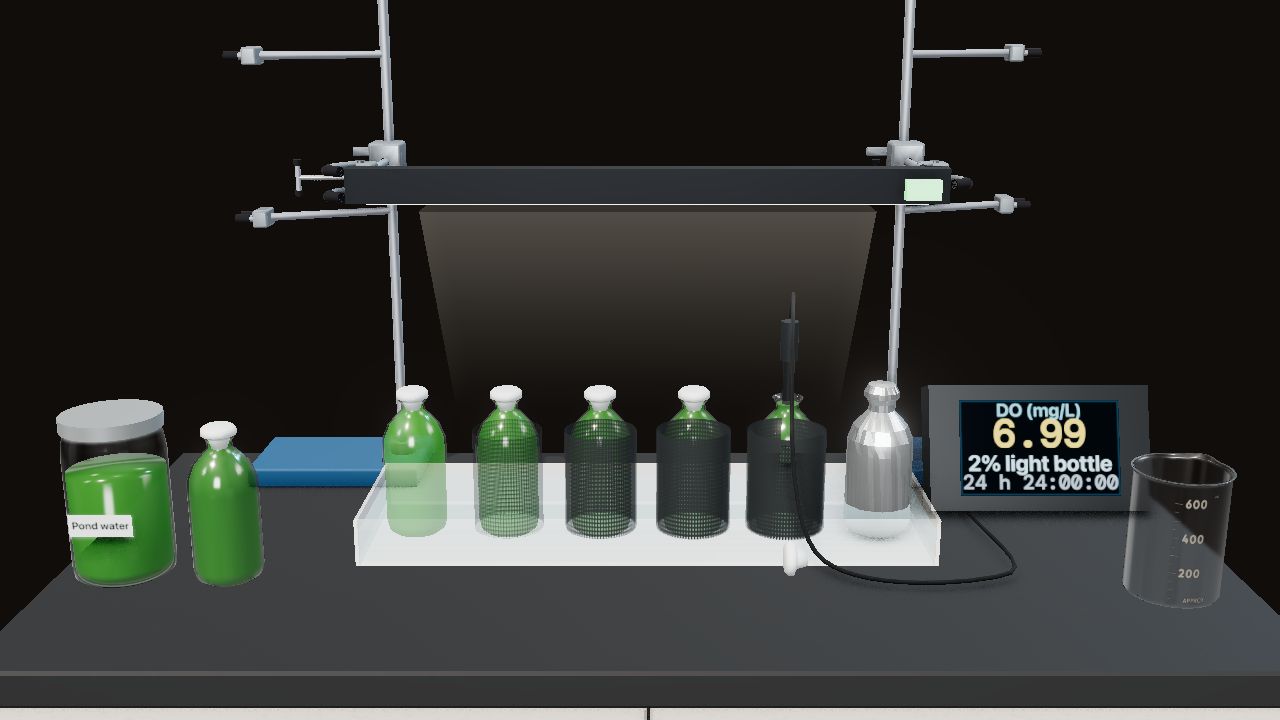
Primary Productivity
Light and dark bottles of pond water. How much oxygen do the algae make?
- Members
Environmental
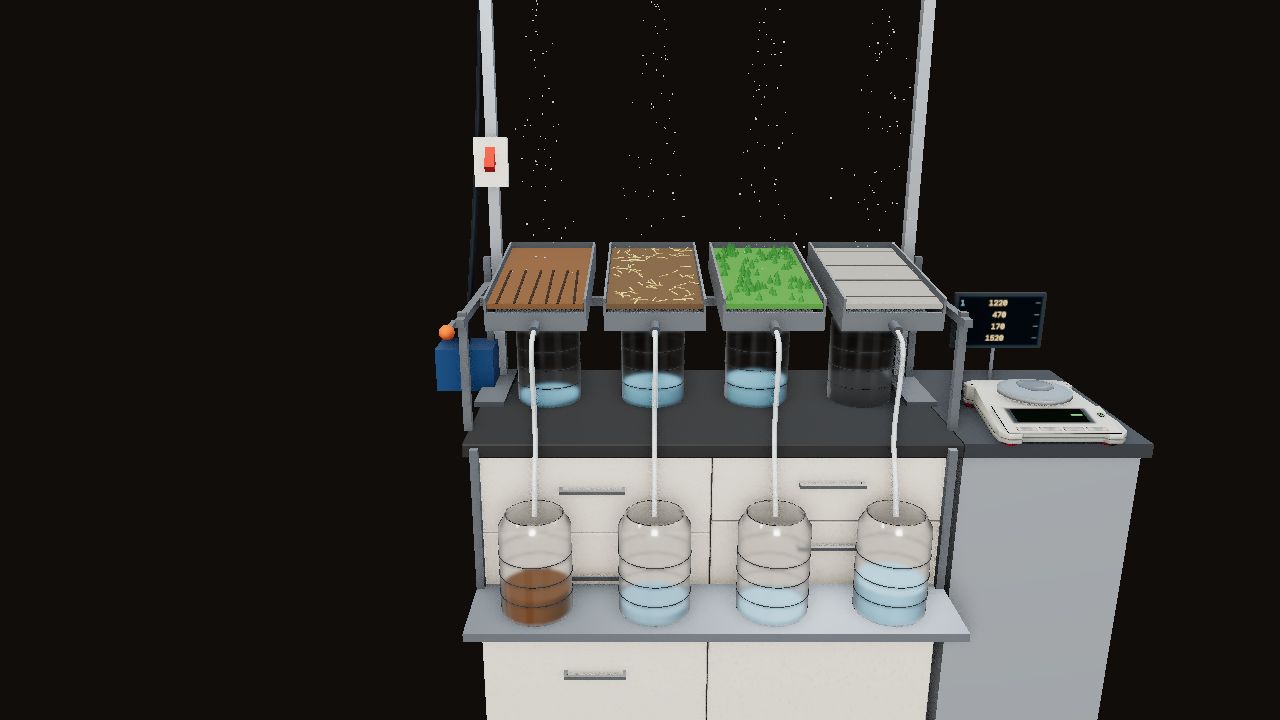
Watersheds, Runoff & Land Use
Rain on a landscape model. Clear it, plow it, terrace it, pave it, and rain again. Where does the water go?


