Environmental · ENV-012
Human Impacts & Habitat Design
A development threatens a bird population. Design, test, and refine a way to reduce the impact.
- NGSS HS-LS2-7
- AP Environmental Science Unit 9
- NY Regents “For the Birds”
Included with a subscription. Create a free account to get started.

About this lab
Lay out a housing plan and evaluate its model habitat and bird-population results. High school students use the interactive 3D setup to choose a development arrangement, move the cluster, select roads and lots, and set a stream buffer before testing the plan. The interior-forest map provides territory observations, with population trajectories recorded over the scenario's time interval. A criteria panel compares habitat, stream, road spending, and farmland outcomes between revisions. These measurements belong to the prompt's constructed teaching landscape, allowing the planning choices to be compared within the stated model and its fixed housing requirement. The experiment is aligned with NGSS HS-LS2-7, AP Environmental Science Unit 9, and New York Regents required lab “For the Birds”.
What this investigation asks
Two housing layouts meeting the same demand can change several habitat conditions at once. This investigation compares development alternatives through forest area, internal habitat, demographic assumptions, stream response, roads, and cost. Begin with the fixed housing requirement and identify all the variables altered by the layout. The goal is to evaluate a combined design impact, not to treat the comparison as a controlled experiment isolating forest clearing when road length and interior habitat change at the same time. A plan can improve one criterion while leaving another constraint unsatisfied.
Design and measure the comparison
Measure or inspect total forest, interior forest, road arrangement, and other course outputs before computing the selected species' habitat capacity. Retain the species-specific territory assumption and the edge definitions. A large total wooded area can contain less interior habitat after fragmentation, but the size of that effect follows the chosen layout and model scale. Compare source observations with the analysis assumptions instead of labeling every excluded band as a directly measured absence of all real animals. The represented edge or housing influence zone provides a teaching rule whose interpretation needs that distinction.
Connect the record to the model
Use interior area and the stated territory requirement to estimate capacity, then use the survival and reproduction inputs to examine a source-or-sink tendency. Capacity and population growth tendency answer different questions. A site can hold potential territories yet fail to maintain the modeled population through its demographic inputs. Evaluate the housing alternatives across bird, stream, agricultural, road, and cost criteria with the same demand constraint. The model combines multiple influences, so a difference in outcome cannot be assigned entirely to one geometric feature without an additional controlled comparison isolating that feature.
Interpret the evidence and its limits
Retain uncertainty in input measurements and in the selected demographic and spatial assumptions. A protection recommendation in the evidence base and a modeled threshold have different identities. Correlation near a road does not prove complete occupancy exclusion at every distance in every species. A final design argument should name the hard constraint, the criteria improved, the remaining tradeoffs, and the assumptions supporting the estimates. Propose a revision and compare its full output rather than claiming one layout is universally best for all organisms, catchments, budgets, and development contexts beyond the course scenario.
Reference conditions and quantities
Before development, the course reference total forest area is 258.125 ha and interior forest area is 250.125 ha. Those are different spatial quantities for the selected grid and edge rule. Neither is itself a bird count. Retain the species territory and demographic assumptions when converting a habitat area into a capacity or source-sink estimate.
Use the record to test your explanation
Write a prediction before collecting the comparison, naming the quantity that should change and the condition you will alter. Keep a reference run and vary one factor at a time when the question calls for a controlled test. Record the selected apparatus settings, units, and measurement interval. Where an activity supplies Ideal and Real modes or seeded variation, retain that identity with each record rather than mixing incompatible runs in one calculation.
Separate an instrument reading or counted observation from the model relationship used to explain it. Keep raw values alongside derived results so another student can reconstruct the argument. A graph needs labeled axes and a stated comparison range. If a result differs from a reference, inspect the conditions, rounding, and measurement procedure before changing the explanation.
For a classroom discussion, compare claims supported by the same evidence and identify an additional measurement that would distinguish competing accounts. Finish with a claim, the relevant observations, and reasoning tied to this course's model. State a specific limitation instead of assigning a general error label to every disagreement.
Related investigations
Compare community evidence in Biodiversity Sampling, then follow land-use water effects in Watersheds & Runoff. Keep total habitat, interior area, expected population capacity, and stream response as separate criteria when evaluating a development alternative.
Common questions
Standards alignment
- NGSS HS-LS2-7
- AP Environmental Science Unit 9
- NY Regents “For the Birds”
More Environmental labs
- Members
Environmental
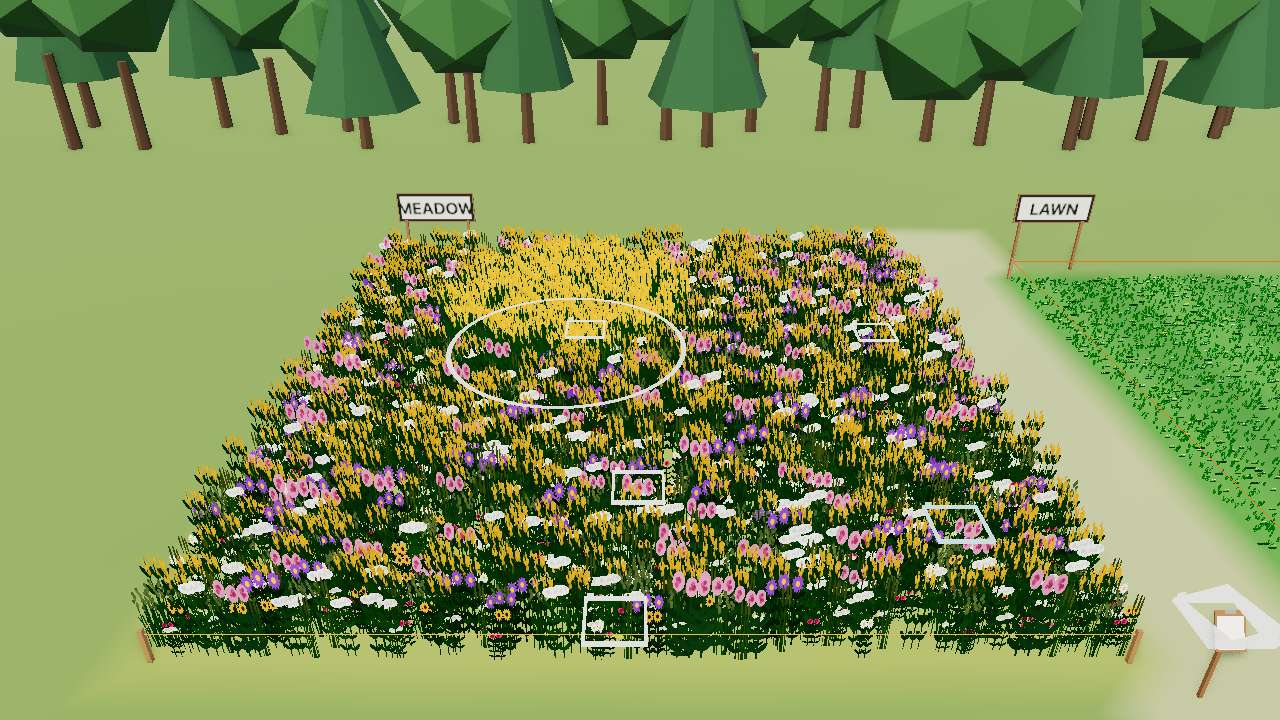
Quadrats & Biodiversity
Throw quadrats in a meadow and a lawn. Which is more diverse, and how sure are you?
- Members
Environmental
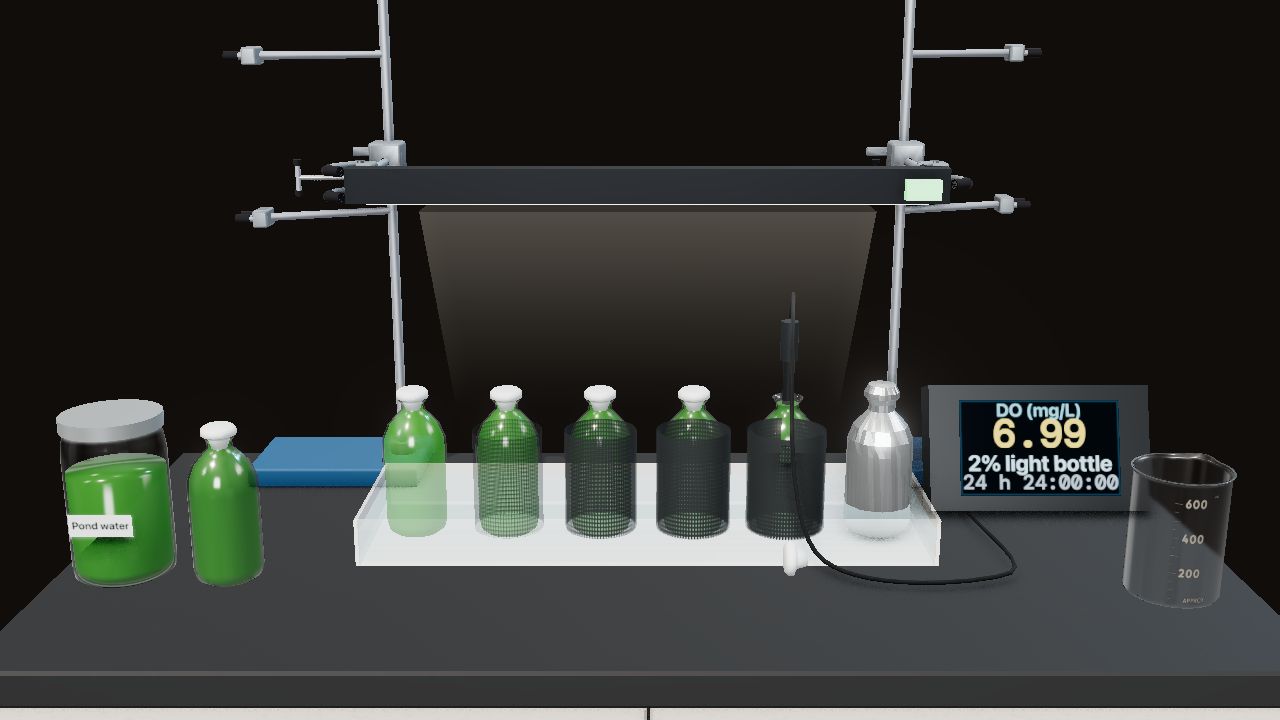
Primary Productivity
Light and dark bottles of pond water. How much oxygen do the algae make?
- Members
Environmental
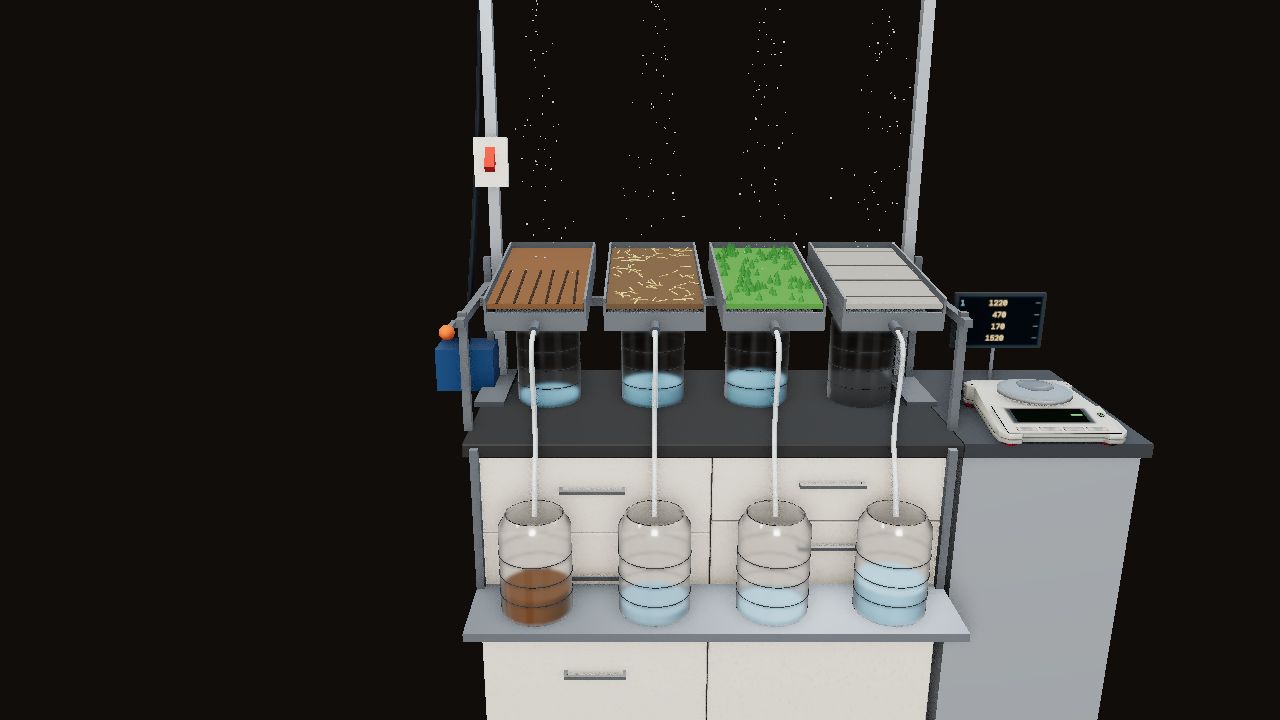
Watersheds, Runoff & Land Use
Rain on a landscape model. Clear it, plow it, terrace it, pave it, and rain again. Where does the water go?


