Environmental · ENV-008
Ocean Acidification
Bubble CO₂ into seawater with a shell inside. What happens to pH and the shell?
- NGSS HS-ESS3-6
- AP Environmental Science Unit 9
Included with a subscription. Create a free account to get started.

About this lab
Bubble selected gases into seawater and measure chemistry alongside a shell-mass comparison. This interactive 3D experiment lets high school students choose the gas mixture, add the cold-bath condition, collect pH and alkalinity observations, and run the longer shell exposure. The carbonate tool calculates dissolved inorganic carbon, carbonate concentration, and saturation from the recorded conditions. Dried-shell weighing adds a physical endpoint to the chemical time series, while an inside view follows the relevant solution species. Published atmosphere and seawater records provide a separate comparison with the controlled beaker observations. The experiment is aligned with NGSS HS-ESS3-6 and AP Environmental Science Unit 9.
What you will investigate
This ocean acidification virtual lab connects atmospheric carbon dioxide, seawater chemistry, carbonate availability, and a modeled shell response. Compare gas conditions and water temperature, read pH and carbonate-related quantities, and use a carbon account to distinguish gas uptake from material released by a shell. The investigation explains a chemical mechanism rather than representing acidification as people simply pouring acid into the ocean.
Dissolved carbon dioxide participates in reactions that increase hydrogen-ion concentration. The course then connects additional hydrogen ions with a shift from carbonate toward bicarbonate. More dissolved carbon does not necessarily mean more carbonate available for shell formation. Keep the different dissolved-carbon species separate in the explanation.
pH is a logarithmic comparison
The course's stated pH example compares the following values. This is a defined curriculum/model calculation, not a new measurement of the global ocean or a verified forecast for every future location.
| Specified comparison | pH |
|---|---|
| First condition | 8.04 |
| More-acidified condition | 7.71 |
The difference is 0.33 pH units. The corresponding hydrogen-ion concentration ratio is 10^(8.04 − 7.71), or 2.137962 in the prompt's calculation. A small-looking numerical pH change can therefore represent a much larger proportional change in hydrogen-ion concentration. Do not describe the concentration change as an ordinary linear percentage of the pH number.
Both pH values remain above neutral in this comparison. Acidification describes the direction of change, not a requirement that seawater become acidic on the usual pH classification. A discussion can distinguish decreasing pH, increasing hydrogen-ion concentration, and crossing the neutral value; they are not the same statement.
Carbonate and shell conditions
The carbonate investigation links the concentration of carbonate ions with the saturation comparison for the selected calcium-carbonate mineral. The course's Ω representation summarizes the defined saturation condition. Interpret the model's threshold together with its chemistry rather than assuming that pH alone completely predicts the response of a shell.
The cold-water comparison matters because the same gas condition can produce a different carbonate/saturation situation at a different water temperature. Keep the other setup quantities fixed before attributing the result to temperature. In Real mode, decide which side of a threshold the particular displayed result supports instead of replacing that observation with an ideal reference answer.
A carbon account and supplied ocean data
The modeled beaker receives carbon through gas exchange and through shell dissolution. The account checks that those contributions are consistent with the change in dissolved inorganic carbon. Calcium and alkalinity changes also have distinct roles in the shell comparison. Gas uptake should not be described as adding every relevant chemical quantity in the same proportion.
The course provides published ocean-data comparisons separately from the simulated beaker. Those records support interpretation of a broader pattern; they do not turn the bench animation into a calibrated prediction of the whole ocean. Gas mixing ratio, wet-gas partial pressure, and the equivalent dissolved-carbon-dioxide quantity are also distinct. Using their numbers interchangeably would obscure the defined model and measurement conditions.
Standards and model limits
The main connection is NGSS HS-ESS3-6 and AP Environmental Science ocean-acidification topics. The carbon-cycle connection covers selected exchanges rather than the entire land–ocean–atmosphere cycle. Gas-exchange rate, shell-dissolution rate, and noise include teaching estimates. The course also states seawater and chemistry approximations, so its values should not be presented as a physical calibration for every salinity or organism.
Ask students to connect a pH comparison with the logarithmic calculation, a carbonate explanation, and the carbon account. Continue with equilibrium and Le Châtelier or biodiversity sampling for another environmental or chemical investigation.
Build an explanation from your records
Make a prediction before changing the conditions, then record a comparison that actually tests it. Keep the conditions attached to each row: a number without its setup can be misleading even when the arithmetic is correct. Explain what changed, what stayed fixed, and which observation supports your conclusion. If the result differs from your prediction, revise the explanation using the evidence rather than choosing a new answer without a reason.
The reference examples on this page describe the course model or its stated source data. They are not measurements collected from a physical laboratory by the reader. Compare like conditions, keep units visible, and distinguish rounded instrument displays from underlying model quantities. Use the investigation's stated limits when deciding whether a result can be generalized beyond the simulated setup. This guide supports preparation and interpretation; practical laboratory technique and safety training remain separate learning activities.
Common questions
Standards alignment
- NGSS HS-ESS3-6
- AP Environmental Science Unit 9
More Environmental labs
- Members
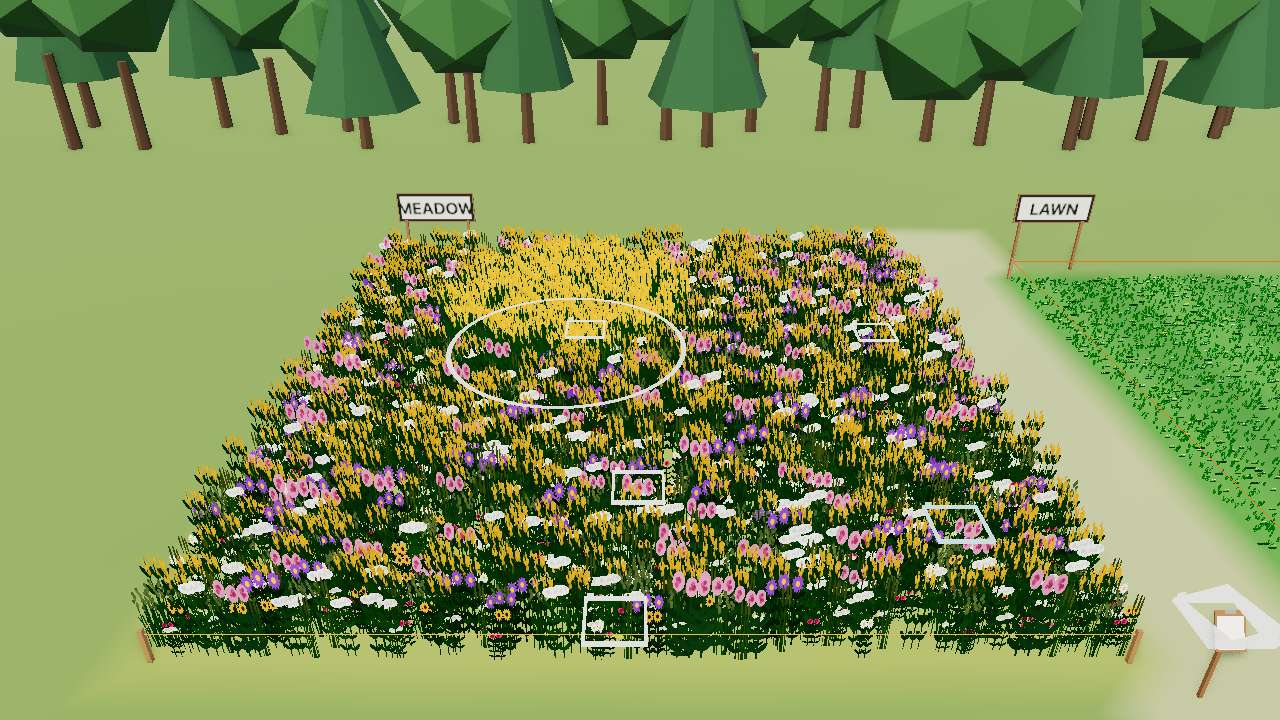
Environmental
Quadrats & Biodiversity
Throw quadrats in a meadow and a lawn. Which is more diverse, and how sure are you?
- Members
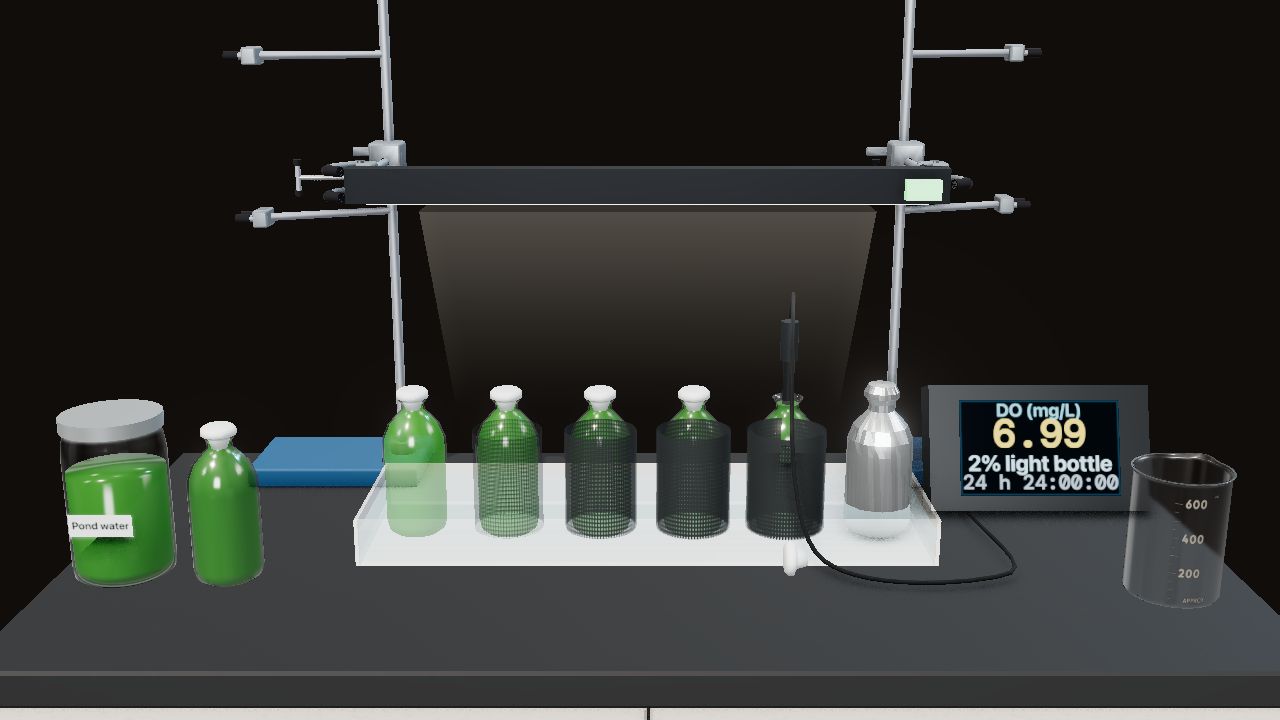
Environmental
Primary Productivity
Light and dark bottles of pond water. How much oxygen do the algae make?
- Members
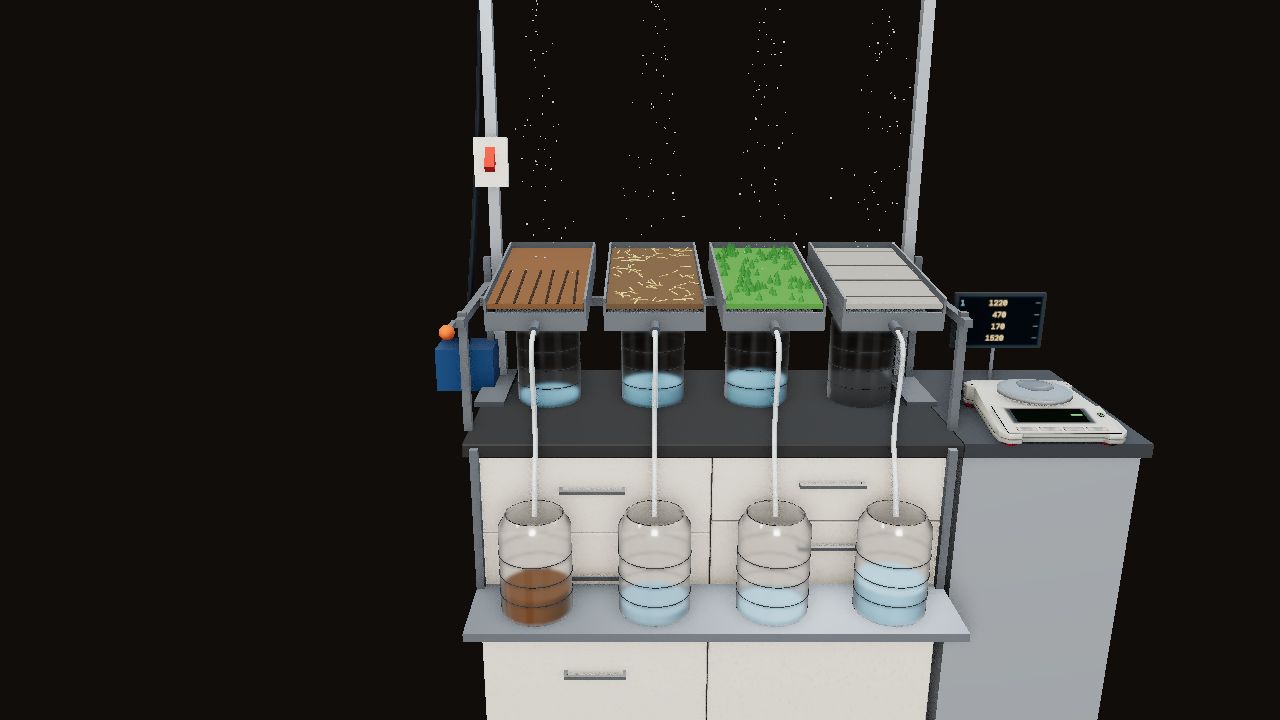
Environmental
Watersheds, Runoff & Land Use
Rain on a landscape model. Clear it, plow it, terrace it, pave it, and rain again. Where does the water go?


